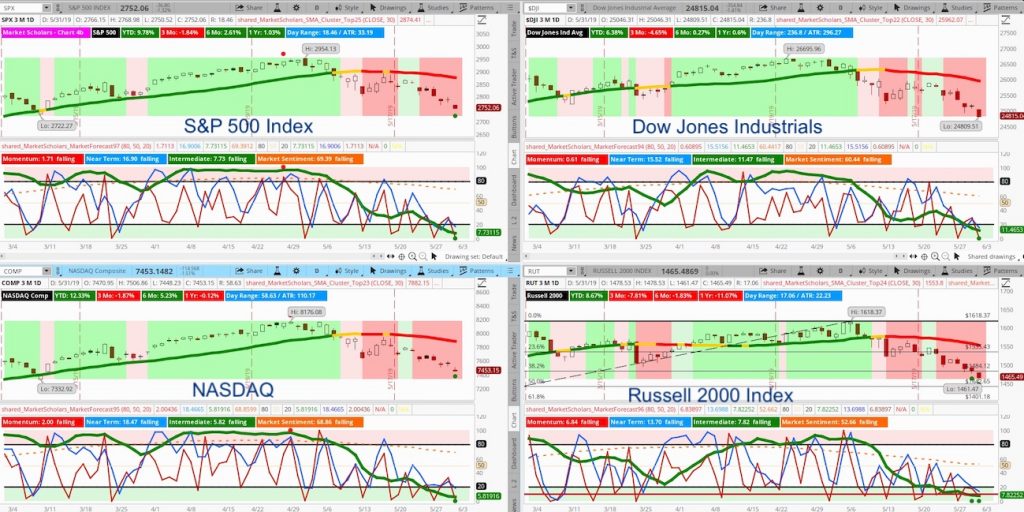
The S&P 500 (NYSEARCA: SPY) has formed some rare oversold patterns on its Market Forecast charts.
First, its intermediate line (green line) is below the 10th percentile and produced an oversold cluster (all three lines finished in the lower reversal zone). This pattern typically leads to a new intermediate run that usually makes its way back to extreme highs relatively quickly – especially when we’re not in “death cross” environments.
Also, the weekly chart is showing an oversold near-term line. The indicator typically does not stay oversold for too long.
Finally, the monthly chart shows an extreme low on the momentum line for the first time since June 2010. This pattern led to a 10-month bullish run that ultimately led to an overbought cluster.
The S&P 500’s pullback still hasn’t reached its 38% Fibonacci retracement level.
The S&P 500 closed below its 200-day moving average after its “golden cross” earlier this year. This has usually produced a bounce as early as the next week towards the falling 50-day MA – especially with the long-term moving averages’ MACD as high as it is.
This decline lacks the strong volatility to both the downside and upside that is usually seen when stocks are suffering major technical breakdowns. In fact, today’s volume was slightly above-average and the trading range (including the overnight gap) stayed easily below 2% of its current value.
Get market insights, stock trading ideas, and educational instruction over at the Market Scholars website.
Stock Market Video – For the Week of June 3, 2019
Finally, the VIX Volatility Index didn’t close above 20 at the open despite being 45 points lower than 5/13 when the VIX closed the day above 20. And, with the S&P closed near its low of the day, the VIX still closed below its open. In other words, volatility isn’t matching the increasing bearish chatter that’s accompanied this 6.5% decline since the 4/30 close.
Twitter: @davidsettle42 and @Market_Scholars
Any opinions expressed herein are solely those of the author, and do not in any way represent the views or opinions of any other person or entity.

: Showing Some Signs of Emerging Strength")
