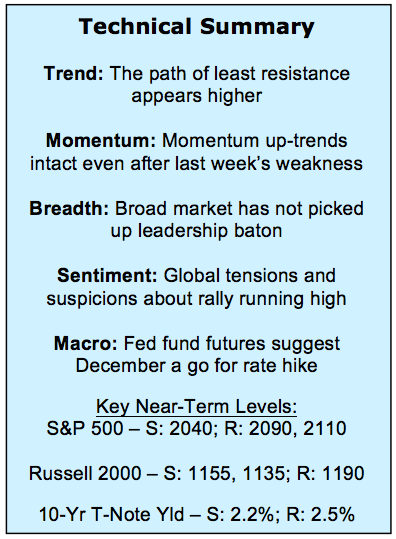
What We Are Watching
This Week’s Stock Market Outlook:
Stocks Ready to Climb Wall of Worry – Skepticism in the strength of the broad market, geo-political tensions, and other concerns seem to be providing a wall of worry that stocks can climb as we work toward year-end. Optimism has down-ticked and skepticism remains relatively elevated even as stocks have rallied this week.
Lagging Vs. Diverging – Large caps stocks have led the Q4 rally and while the broad market has lagged the popular averages, it is premature to suggest that we are seeing market breadth divergences. A lack of confirmation is not synonymous with a divergence. If small caps stocks hold to their strong seasonal tendencies, market breadth could soon be playing catch up and that would help the broader stock market outlook.
Casting a Glance Overseas – The long-term trend favoring US leadership is intact, but momentum is cooling as price has reached resistance. Europe is starting to attract in-flows and the trends there are improving on both an absolute and relative basis. We see little evidence that trends in emerging markets are poised to improve.
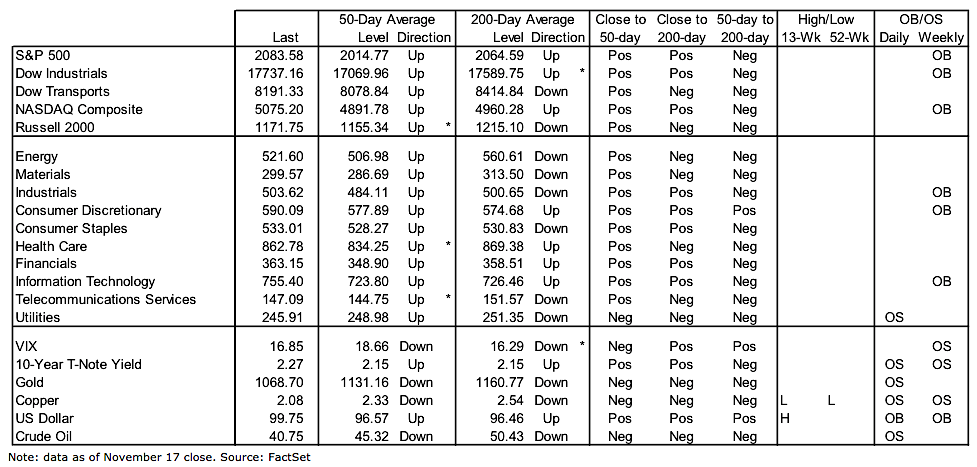
Stock Market Indicators – Indices & Sectors (click to enlarge)
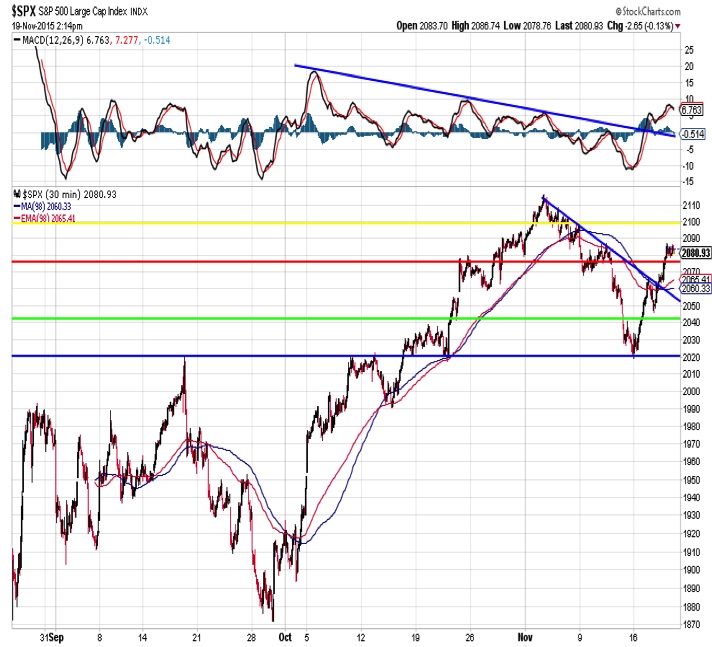
S&P 500 Index
The short-term chart for the S&P 500 shows that technical support near 2020 has held and the index has moved higher through the downtrend line that emerged off of the early-November highs. This move improved the shorter-term stock market outlook.
Note that momentum is expanding again, and that could be the fuel for a year-end rally.
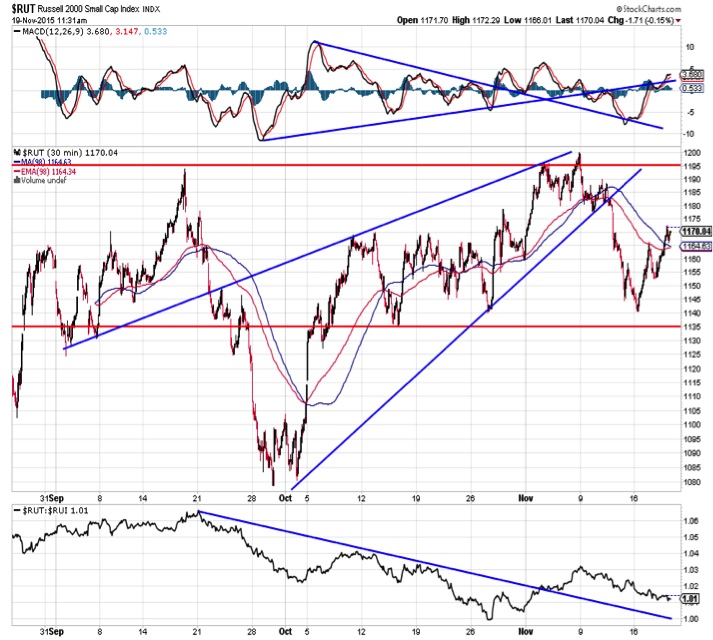
Russell 2000 Index
As has been the case for most of the second half of the year, the chart on the Russell 2000 is more ambiguous. Support near 1135 has held and that argues for a test of the top of the trading range (near 1195). The relative price line is above its late-October low and momentum has showing some signs of getting back in gear. Small caps stocks enjoy a strong seasonal tailwind into February, so an inability to hold above the recent absolute and relative price lows could be telling.
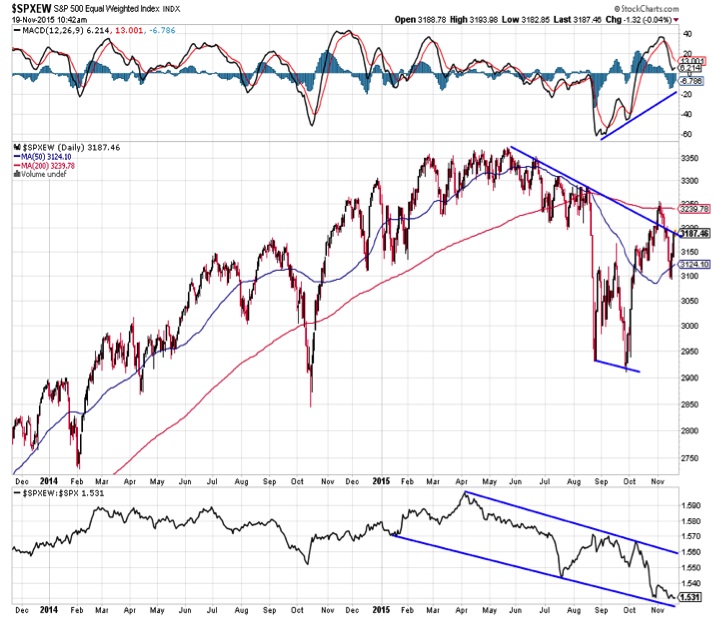
S&P 500 Equal Weight Index
We could take our pick of indicators/charts to show how the broad market has lagged the rally seen among the large-cap indexes this quarter. This is the equal-weight S&P 500. The bottom clip shows the trend favoring the cap-weighted index remains intact. But the equal-weight index has rallied off of its September low, breaking briefly above the downtrend line before finding support near the 50 day moving average. Stock market momentum continues to trend higher.
continue reading on the next page…


: Showing Some Signs of Emerging Strength")
