S&P 500 shows renewed strong bullish posture after brief, shallow weakness last week – similar pattern to early 2016 of volatility just after S&P crosses above 200-day MA.
Russell 2000 and Dow Jones Industrial Average are both showing relative weakness for separate reasons. Boeing drags the Dow lower. But weakness in small caps may be a headwind for a continuation of the current bullish intermediate trend.
Fibonacci fans and retracement levels still show levels of support both just above 2700 and around 2640 by the beginning of April. Early April to mid-July is typically a bullish period for equities.
Heikin Ashi weekly candles showed a second consecutive transition candle that actually may lead to 1-3 more bullish candles starting with next week before we get any intermediate pullback.
The MACD and Stochastic indicators do not show imminent reversal opportunities but do show a clear pattern of slowing bullish momentum and emerging bearish divergences.
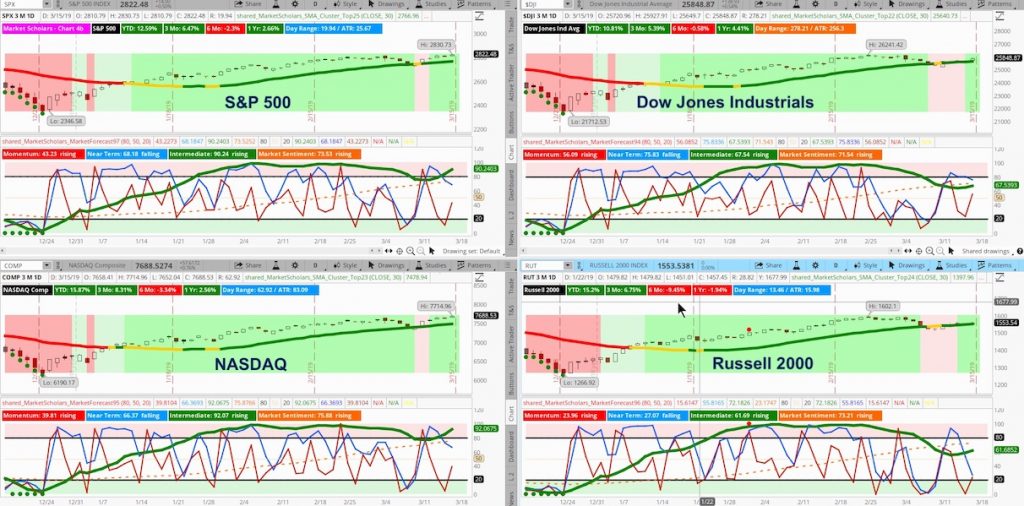
The S&P 500 and Nasdaq are trading at the upper end of their 4-week range with new highs in the past few days. But, the Russell actually dropped into the lower half with the late-day selling into the close.
In fact, after strong relative strength immediately after the Christmas Eve low, the small-cap index is starting to form a potential head and shoulders on shorter timeframes.
Subscribe to the Market Outlook daily email list to get the daily and weekly overbought and oversold Market Forecast clusters watchlists for the S&P 500.
Weekend Market Outlook Video – Week of March 18:
Below is a chart and some additional bullet points discussed in this weekend’s video:
- Volatility has closed down to low, bullish levels. Any pullback we get in stocks would simply be that according to current volatility levels. There isn’t an expectation of a bearish long-term trend any time soon.
- Crude oil was the best performer this week with weakness in the U.S. dollar. In fact, crude appears to be breaking out. On the other hand, gold is struggling through areas of strong volume resistance. Emerging Markets are also benefitting from USD weakness
- Manufacturing surveys and falling YoY industrial production continue to show a softening macro picture. Also, TIC flows are dropping to negative levels . This is not a “risk on” environment – especially with a rapidly deteriorating trade balance. In fact, rate cut odds are starting to rise with 10-year yields close to inverting with the Fed Funds target rate.
- Technology had a good week as lagging FANG stocks led the way higher but investors continue to show a move towards safety despite the bullish trend. Economically-sensitive areas continue to struggle with falling growth expectations
- Bearish trade example in Healthcare sector of a stock that has formed a base during a period of underperformance and may be showing signs of developing into a new bullish trend.
Twitter: @davidsettle42 and @Market_Scholars
Any opinions expressed herein are solely those of the author, and do not in any way represent the views or opinions of any other person or entity.

: Showing Some Signs of Emerging Strength")
