Despite Friday’s weakness, S&P 500’s posture remains strongly bullish in intermediate and long terms.
The extreme low on the momentum line (red line on Market Forecast) suggests we may be due for some short-term weakness. The near-term line (blue line) is coming down from a divergent bearish high point.
The S&P 500’s weekly chart shows a (relatively) long upper shadow that can also be viewed as indicative of short-term weakness. Heikin Ashi candles point to another potential transition candle next week after this week’s bullish candle.
The Russell 2000 already shows a strengthening bearish posture with a falling six-week moving average (most likely in the next couple of days). Also, the Dow Jones Industrial Average shows a renewed bearish posture.
The Russell 2000 broke back down hard below falling 10-week and 40-week EMAs. Unlike its large-cap counterparts, the Russell has not formed a “golden cross” yet.
The S&P 500 showed its first red arrow on the MACD. Usually the Stochastic comes next followed by the 6-week SMA. The S&P 500 is testing its rising 17-day EMA. This gives context to the extent of Friday’s sell-off compared to the preceding rally. The Russell 2000 is already showing all 3 red arrows with a falling 6-week SMA.
The big topic of the day was yield curve inversion and its impact on the stock market. Today’s video dives into that relationship to get an idea of what to expect. My premium Technical Analysis class at Market Scholars make a deeper dive into previous inversions to see where money could rotate into and what to watch for.
Subscribe to the Market Outlook daily email list to get the daily and weekly overbought and oversold Market Forecast clusters watchlists for the S&P 500.
Weekend Market Outlook Video – Week of March 25:
Below is a chart and some additional bullet points discussed in this weekend’s video:
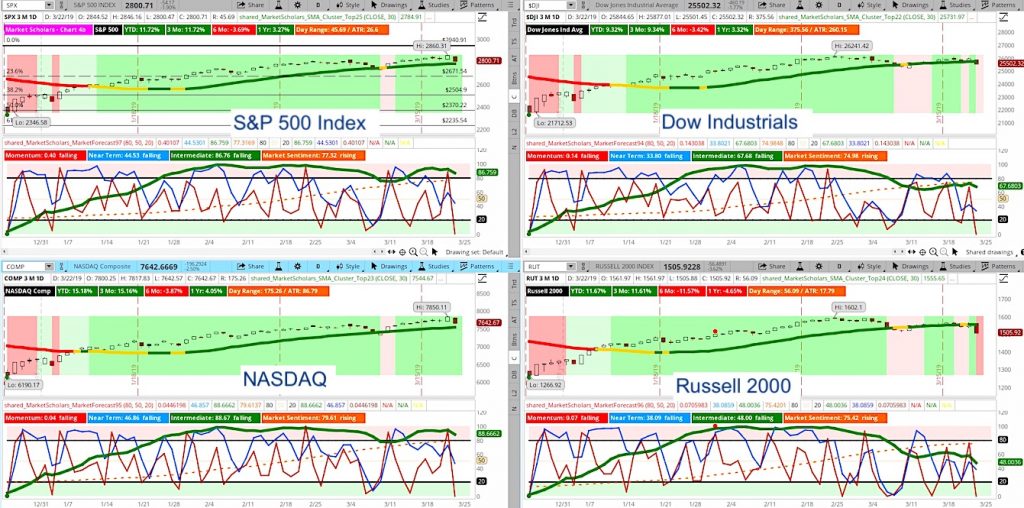
- While the Russell 2000 formed a new 4-week low point, the S&P 500 is flirting with falling into the lower-half of its four-week range. Again, this suggests any weakness we get may not be anything more than temporary.
- Trading ranges, average volume and volatility are all rising from low levels confirming the idea the pullback and giving it more legs than just a potential one-day decline.
- Not surprisingly, long-term bonds were the best performer of the week whereas small-cap stocks were the weakest performer.
- Utilities and Real Estate and Staples have been the best performers over the past 200 days. This is actually a strong bullish signal suggesting any pullback we get again will simply just be that before a continuation of the long-term bullish trend – despite the existence of inverted yield curve.
- Bearish trade example in Consumer Discretionary sector of a stock that has formed a head and shoulders price pattern and is breaking through its neckline with other bearish technical signals suggesting a bearish trade opportunity.
Twitter: @davidsettle42 and @Market_Scholars
Any opinions expressed herein are solely those of the author, and do not in any way represent the views or opinions of any other person or entity.

: Showing Some Signs of Emerging Strength")
