Here’s a look at some key stock market indicators, charts, and themes that we are watching.
This Week’s Stock Market Outlook:
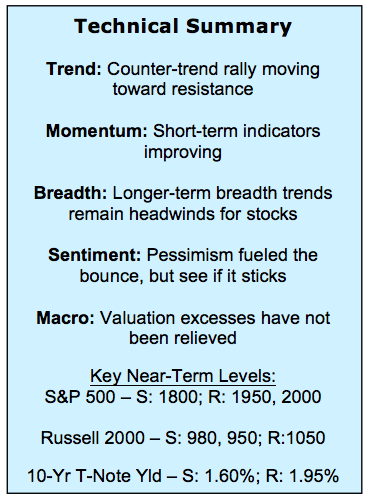
In a Down Trend, Keep an Eye On Resistance – Excessive pessimism and widespread oversold conditions helped fuel a near-term bounce for stocks. The longer-term trends can get obscured by the day-to-day noise in the stock market. The longer-term trends for most areas of the stock market are lower, and in such an environment it pays to keep a close eye on price resistance levels. Failed rallies can be quickly unwound.
Stock Price Bounce Being Echoed In Momentum Indicators – While the S&P 500 Index has had a tremendous rally off of last week’s lows, we have yet to see broad endorsement of this move in the form of a 10-to-1 up day. Nonetheless, at the index level we are seeing a turn higher in near-term momentum and this could help the popular averages challenge key price resistance levels.
Short-Term Market Breadth Indicators Look Less Bad – Short-term market breadth tenuously improved. But this has not manifested itself in the longer-term breadth indicators that for over a year now have suggested that stocks have slipped out of gear. These gains are the type of preconditions, however, that can lead to more significant positive divergences.
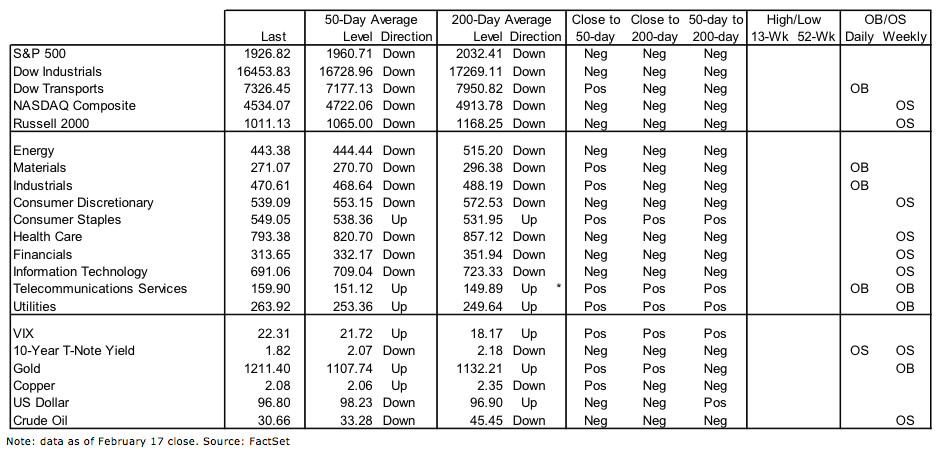
Stock Market Indicators – Indices & Sectors (click to enlarge)
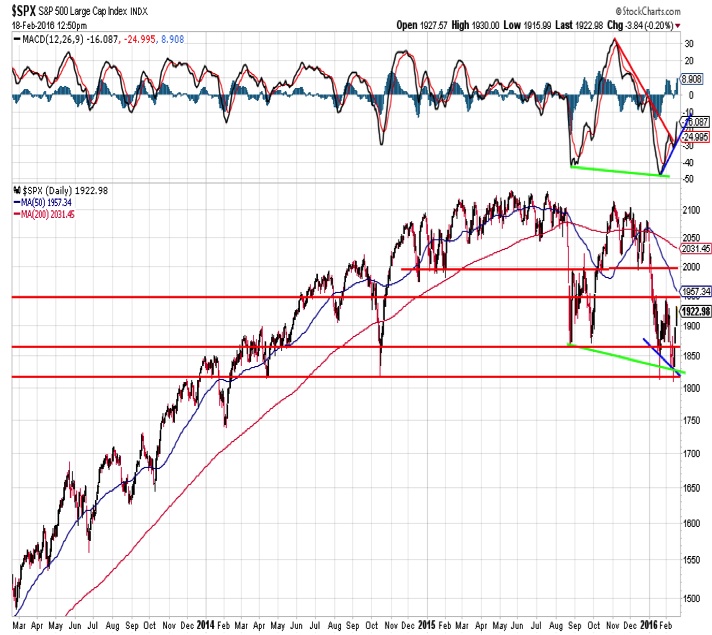
S&P 500 Index
The S&P 500 bounced off support near 1800 with an impressive rally that saw the S&P 500 gain more than 1% on three consecutive days. With this move coming off of a 52-week low, history would suggest some caution going forward (h/t @NautilusCap). Also important is that price resistance looms just ahead (first at 1950 and again near 2000). Momentum has turned higher on at least a short-term basis and that could help the short-term stock market outlook and fuel further near-term rally attempts. For now, price remains below the falling 50-day average, which is below the falling 200-day average. That is not a long-term bullish set-up.
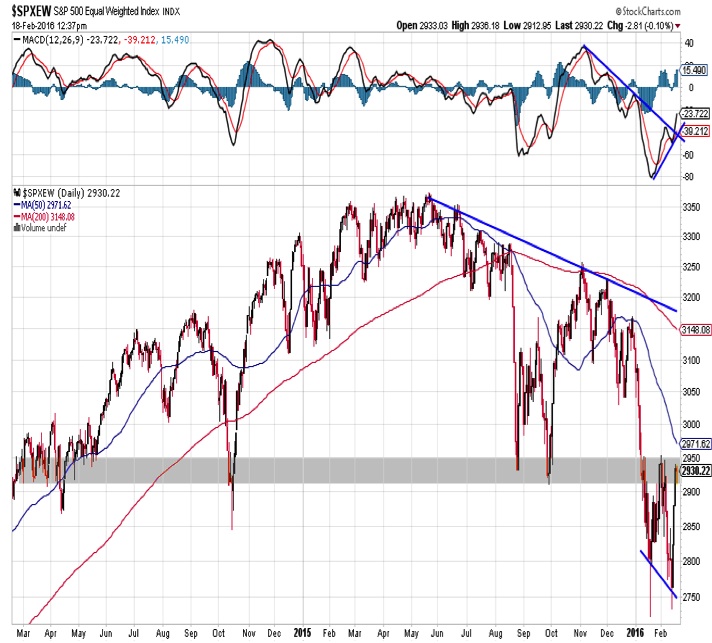
While the peak-to-trough decline for the equal-weighted S&P 500 (18%) has exceeded that of its cap-weighted counterpart (15%), we are seeing some similar improvement in the chart. After a year of discussing how the average stock is faring worse than the index, this is encouraging. However, more work needs to be done. Momentum has turned higher and diverged from price, but the price action so far is not yet consistent with a sustained rally, which could weigh on the intermediate-term stock market outlook.
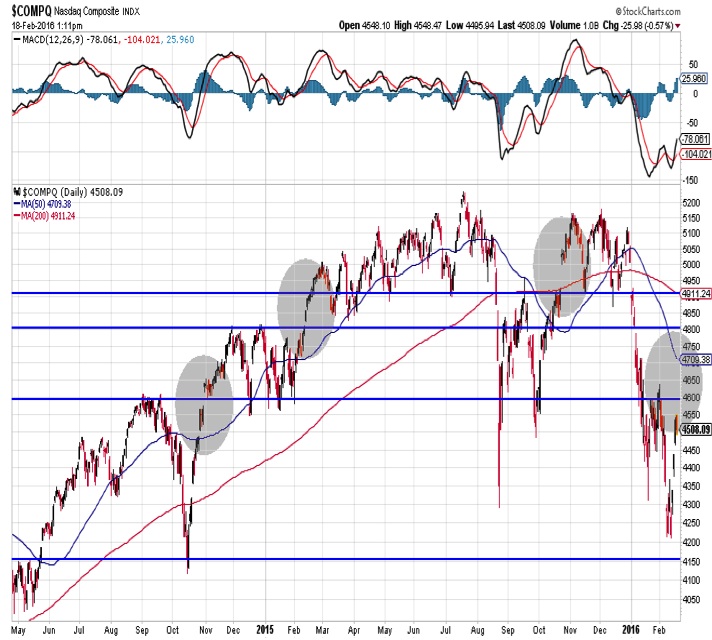
The Nasdaq Composite
A similar pattern can be seen on the chart of the NASDAQ – rally toward resistance supported by a turn higher in momentum. If this move is more than just a pessimism-fueled bounce, it should be evident in the price action. What is missing so far is a strong move through resistance. In previous instances over the past two years, the NASDAQ gapped higher through price resistance and rallies were able to continue. Then, however, the underlying trend was rising. That is not the case now.
continue reading on the next page…


