The stock market has stalled out and traded sideways for several days.
Is it ready to turn lower, or simply consolidating? Today, we take a look across the various assets classes to highlights trends, relationships, and strengths and weaknesses at a macro level.
This is a good first step before drilling down to sectors and stocks. Let’s dig right in and take a look at six interesting macro market charts.
Monday’s Macro Market Trends – Week of July 18
Equities
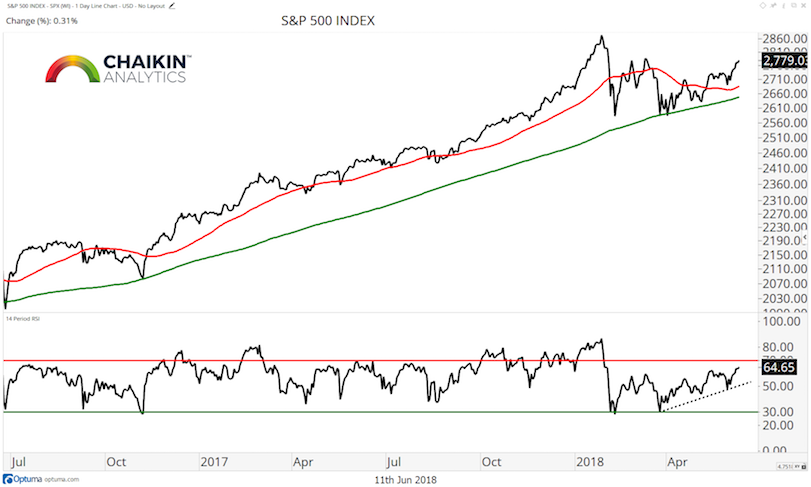
On a closing basis, the S&P 500 is trading within 1% of the next resistance level which we have been highlighting, around 2,800. The index is above the rising 50 & 200-day moving averages and the RSI remains in bullish ranges after a series of higher lows. We remain of the view that the secular bull market is still in place while being open to the possibility of a pause near resistance.
Small Caps Remain Leadership
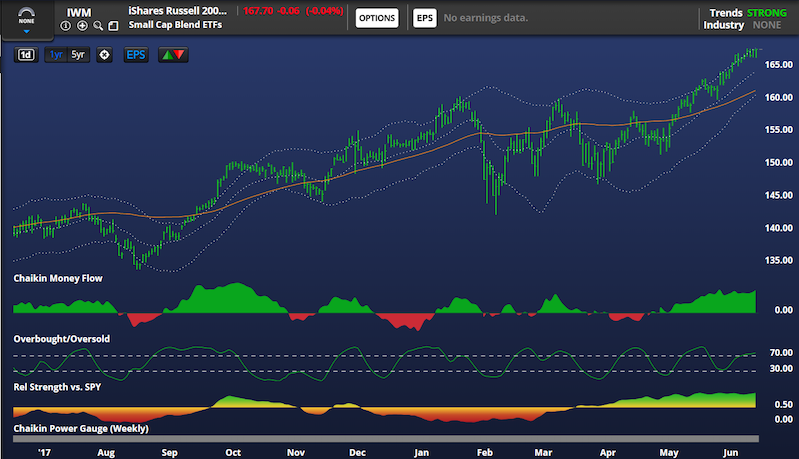
The Russell 2000 maintains a stronger technical position than the S&P 500, having registered a new all-time high last week. The iShares Russell 2000 ETF (IWM) has been leading the SPY since March and we expect that trend to continue. As the fund trades near its highs, the Chaikin Money Flow Indicator is registering strongly bullish readings. However, in the near-term, we would not be surprised to see the IWM consolidate as our Overbought/Oversold Indicator is near overbought levels.
Credit
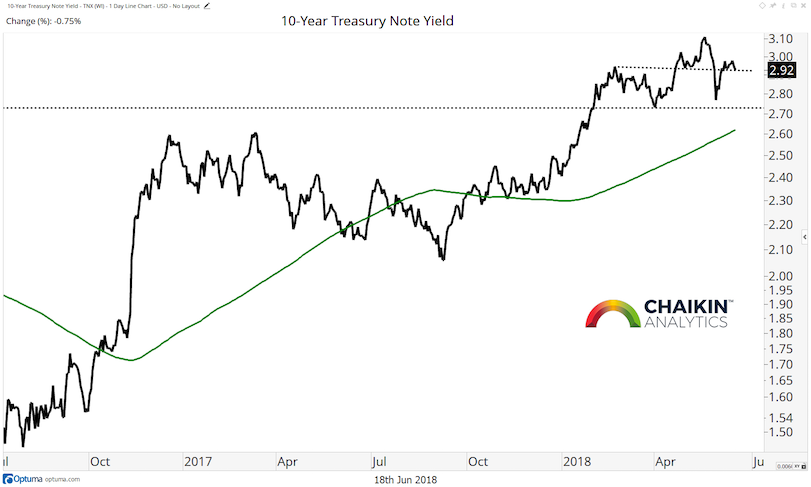
The 10-year yield saw a lot of volatility last week but ultimately closed lower and below near-term support around the 2.95% level. The 200-day moving average of the yield is rising and now sits at the key breakout level of 2.6% – 2.62% We continue to see the path of least resistance as higher for yields but are open to a test of the recent lows around 2.75%. We do not expect higher yields to have a negative impact on the overall stock market until the yield reaches closer to 5%.
We ran an analysis to study how the S&P 500 responds to rising interest rates. Going back to 1963, we found that when the 10-year yield is higher than it was one year prior and is below 5%(such as the current environment), the S&P 500 is higher one year later 89% of the time with a median return of 10.60%. This tells us that rising rates, on their own, are not a cause for concern for the equity market currently.
Commodities
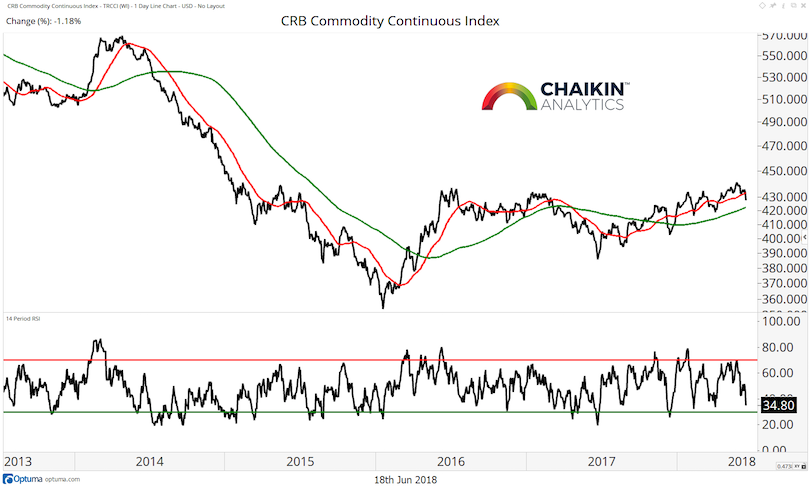
For the past two weeks we have been calling out the unconfirmed nature of the move in commodities as price highs were not met with new highs in the RSI. The index fell last week to close below the 50-day moving average while remaining above the 200-day moving average. The RSI continues to fall and has room to oversold conditions.
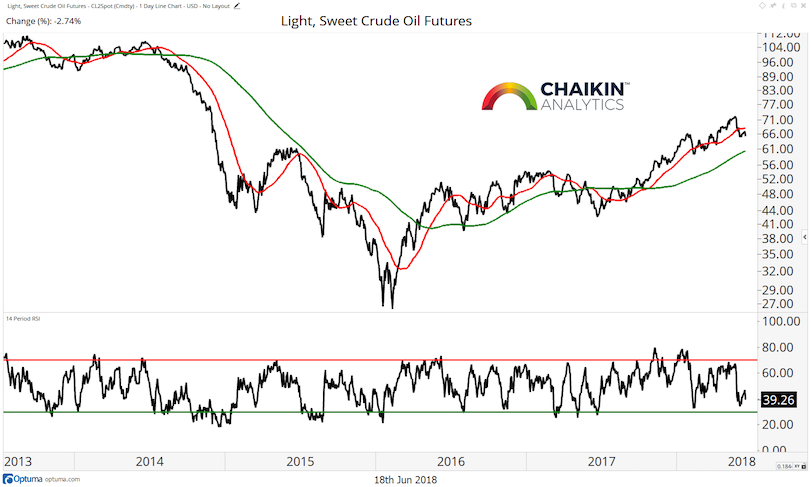
Crude Oil pulled back below the rising 50-day moving average and remains above the 200-day moving average. The RSI remains closer to oversold after registering a negative divergence with price at the recent high. Further weakness in Crude Oil has the potential to impact the E&P companies in a negative way but should be a positive for refiners. Support comes into play at the rising 200-day moving average near $61.
U.S. Dollar Index
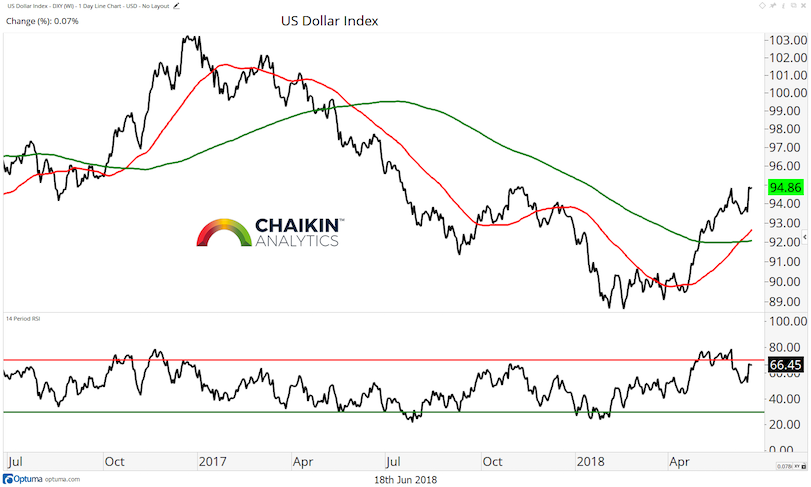
The dollar index rallied to, once again, test resistance at the 95 level. Last week we wrote that short-term weakness in the Dollar Index was a temporary pause in the early stages of a new uptrend and that remains our view. The 50-day moving average has crossed the 200-day moving average and the RSI is in bullish ranges.
You can gain more insights into our methodology and stock picking over at Chaikin Analytics. Thanks for reading.
Twitter: @DanRusso_CMT
Author may have a position in mentioned securities at the time of publication. Any opinions expressed herein are solely those of the author, and do not in any way represent the views or opinions of any other person or entity.


