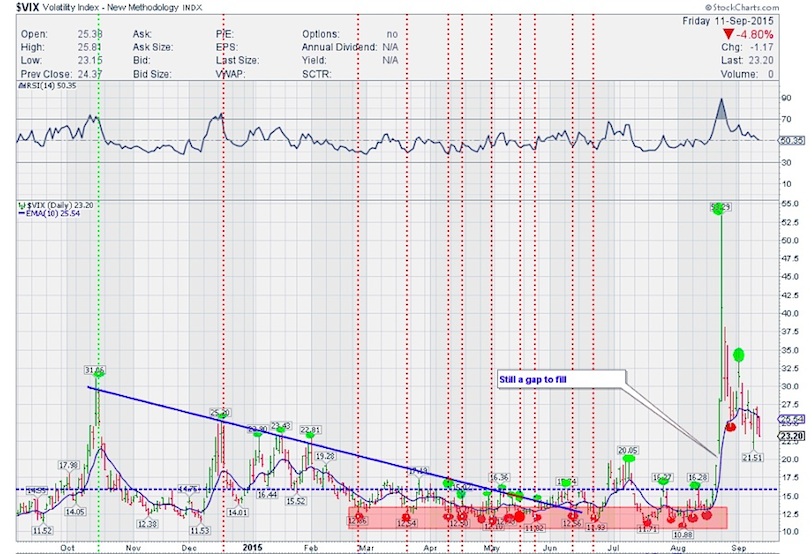
VIX (Volatility Index) went lower to start the week below the coveted 22 mark – around 21.51 and then spiked up. It finished the week at 23.20 but still above 22. As long as it is not < 22 or even 20, expect elevated volatility. I pointed that MACD wanted to cross lower and it has very well done that plus falling now although above the 0 line. RSI is falling too and right at median. RSI on the weekly chart (not in the blog post) is falling but MACD is still holding up. Overall watch 22 and 20 – if they get taken out, it will bode well for equities in the shorter timeframe for higher prices.
$SPY Daily Timeframe:
On a daily timeframe, the S&P 500 ETF (SPY) started the week higher on Tuesday. However, on Wednesday once it hit resistance, started falling and printed a Bearish Engulfing candle. If you had noticed, I had mentioned quite a few times about the 200 strike to be resistance as there were a lot of puts in OI. Exactly a spot where it reversed. Overall, absolutely no respite in the selling and looked like Algo hitting block sells one after the other. Ugly finish on the day overall. When everyone was positioned for a nasty Thursday, $SPY did the opposite. It moved higher but in a choppy range and action. On Friday, it continued higher. Some constructive action but still choppy range-bound action. Nothing more. Range is getting tighter though.
As far as momentum momentum indicators go, RSI is rising but slowly and is near the median. MACD has made a cross higher but still way below the zero line or median. Slow STO is rising above median and this along with the MACD cross are a small positives that we can see as of now. All this can change with this range-bound chop any moment.
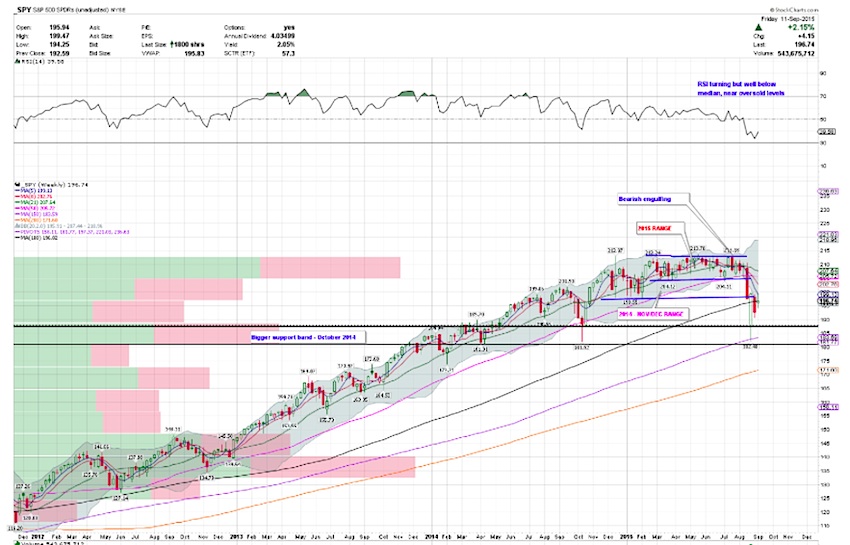
$SPY Weekly Timeframe:
On a weekly timeframe, $SPY is consolidating right below the 2014 November-December range. Prior support is acting as resistance. The moving averages continue to fall. If price can get above 200, then there is room to 203-204 levels where there is a gap fill (shown below in the 60 min chart). There is heavy overhead supply above that and a stall there can be expected if it can get there.
With respect to momentum indicators, MACD continues to fall below median. No respite there. RSI and STO are turning but well below median. However this is a positive sign for any continued upside momentum in the shorter timeframe.
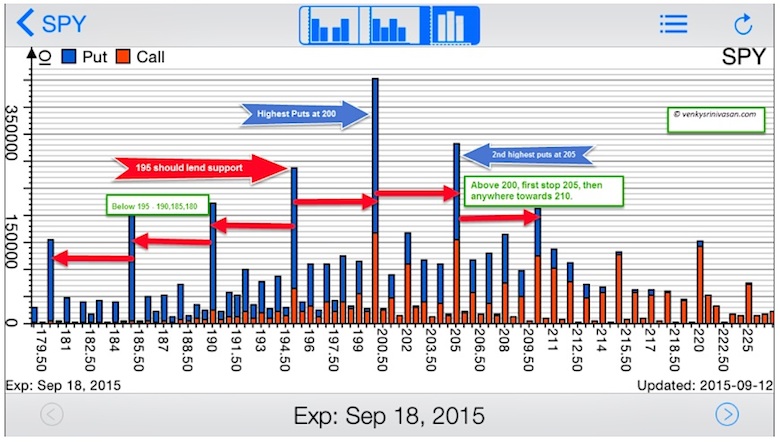
$SPY OPEN INTEREST:
Highest Puts: 200
Highest Calls: 200
Bullish Scenario:
200 has both highest calls and puts. If 195 holds, a trip to 200 first. 200 has been a resistance zone in the recent past. If price can get above 200, we can see 205 and this should fill the gap that I mentioned between 203-204. With Fed being a trump card for any higher prices, anything can happen. Above 205, there are chances of 210 being seen. Not something I will rule out with another gap fill between 207-208. Just saying that keep an open mind.
Bearish Scenario:
If 195 doesn’t hold with any unfavorable news from the Fed, 190 is the next support zone. But then that will rule out some of the bullish thesis. Below that there are chances of 185 and 180.
Keep in mind the following:
- This upcoming week is September Options Expiry.
- $SPY Rebalance.
- $SPY goes ex-dividend.
- A ton of economic news.
Thanks for reading and have a great week.
Twitter: @sssvenky
Read more from Venky on his blog.
No position in any of the mentioned securities at the time of publication. Any opinions expressed herein are solely those of the author, and do not in any way represent the views or opinions of any other person or entity.


