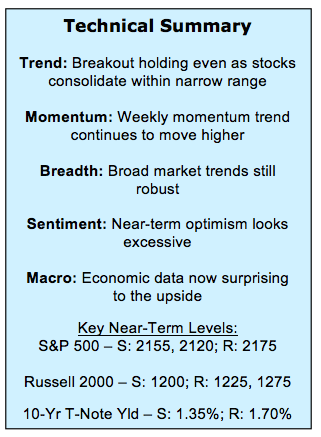
Weekly Stock Market Outlook & Technical Review (July 29)
Here’s a look at some key stock market indicators and emerging themes that we are watching:
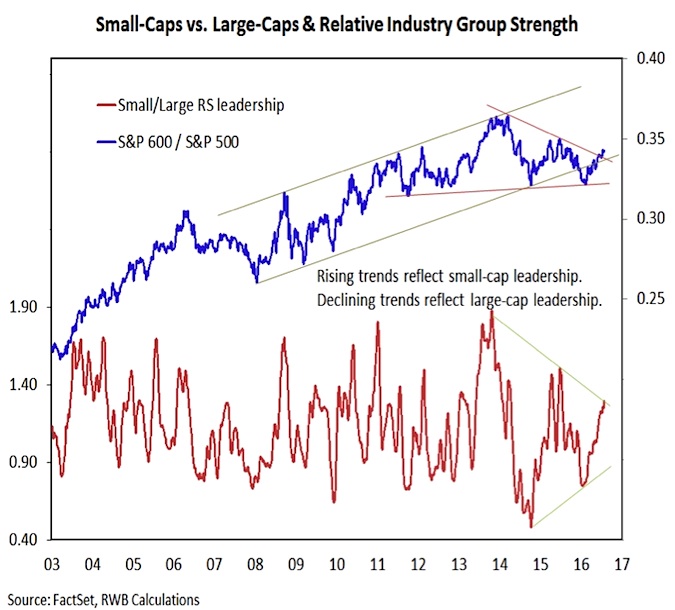
Small-Caps Working Higher Versus Large-Caps – On an absolute basis, both the Russell 2000 Index (INDEXRUSSELL:RUT) and S&P 500 Index (INDEXSP:.INX) have moved into (and so far remain) in historically tight consolidation phases. On a relative basis, however, small-caps have gained strength versus large-caps. This can be seen from a price ratio perspective (S&P 600 vs. S&P 500 or Russell 2000 vs. Russell 1000) and also in terms of industry-group leadership.
How to Know We Are Getting Back in Gear – Longer-term market breadth trends are still favorable but we are watching several shorter-term indicators for evidence that the consolidation phase is winding down. Specifically, we’d expect to see a strengthening in our sector level trend indicator and an expansion in issues making new highs to have confidence the rally is ready to resume.
Keeping an Eye on Bonds – The bond market remains to see excessive optimism as the relative attractiveness of U.S bond yields (versus international bonds) has offset evidence of higher inflation and a generally better tone from the economic data. This could be changing, however, as the yield on the 10-year T-Note may have made a higher low.
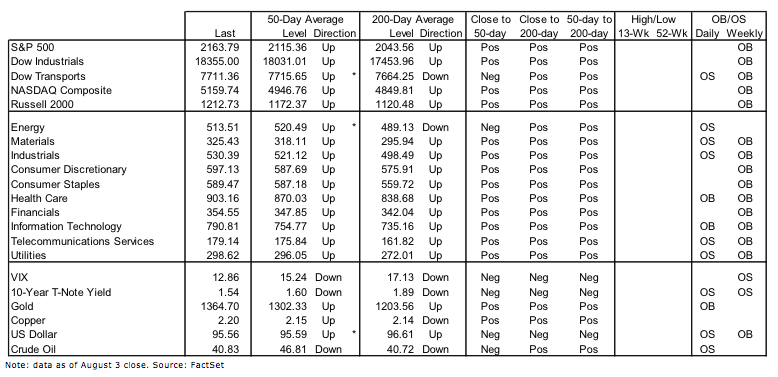
Stock Market Indicators – Indices & Sectors (click to enlarge)
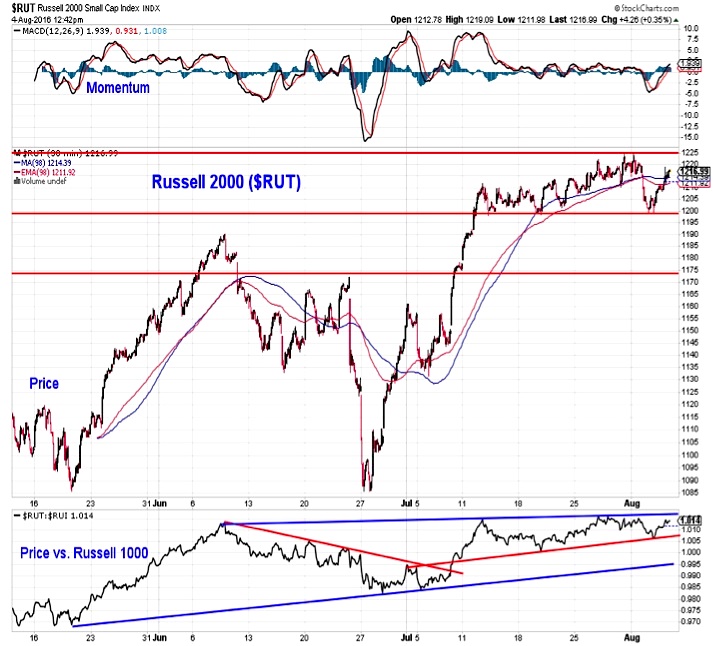
Russell 2000 Index
The narrow trading range seen on the S&P 500 since mid-July attracted most of the headlines, but the Russell 2000 has also moved sideways during that time period. Support on the Russell 2000 is near 1200 and again at 1175. Resistance is near 1225. Relative to large-caps however, small-caps continue to drift higher. The Russell 2000 has not made a significantly higher high versus the Russell 1000, but it has made a series of higher lows. This is a constructive step in the market outlook for small caps.
When we look at industry group trends and rankings based on market-cap, we get another gauge of the trend in leadership between small-caps and large-caps. This ratio (the Small/Large RS leadership line) shows that small-cap groups have moved relatively higher in our industry group rankings. Both this indicator and the ratio between the S&P 600 and the S&P 500 are on the cusp of clearing resistance and arguing for a another leg higher (at least on a relative basis) for small-caps.
Market Breadth
We are watching some short-term market breadth indicators for evidence that the rally is ready to resume. The McClellan Oscillators (or similar variants) give good appraisal of near-term momentum in the breadth data. Moreover, a return to positive territory for that indicator would be evidence that upside momentum is building. It would also bode well for the market outlook.
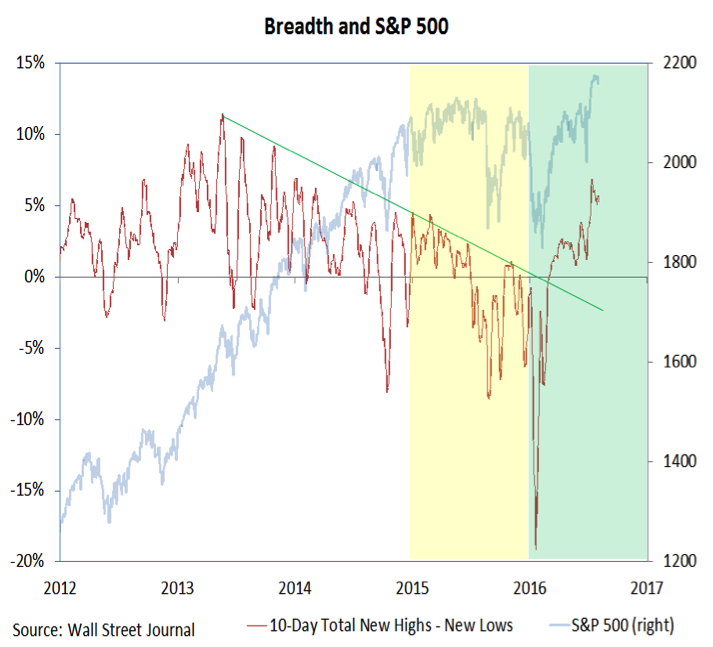
We would also expect to see a renewed expansion in the number of issues making new highs. We’ve continued to see a relatively healthy number of stocks making new highs even as the S&P 500 index has moved sideways. However, another leg higher in this indicator could be fuel for the popular averages.
continue reading on the next page…

: Showing Some Signs of Emerging Strength")
