Stock Market Outlook & Technical Review For October 28
Here’s a look at some key stock market indicators and emerging themes that I am watching in my latest S&P 500 Weekly Stock Market Outlook:
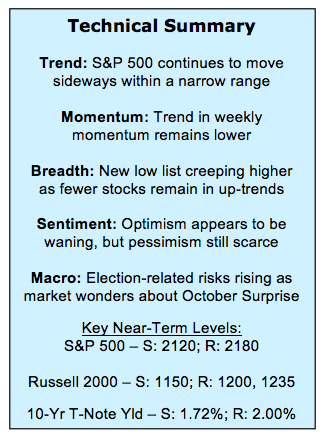
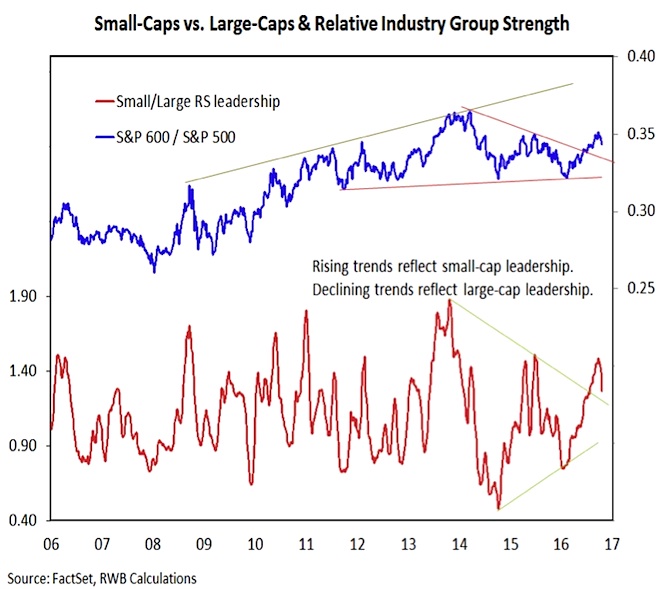
Small-Caps Taking a (Not Altogether Unexpected) Breather – While the large-cap S&P 500 (INDEXSP:.INX) has moved sideways within a narrow range, the small-cap Russell 2000 (INDEXRUSSELL:RUT) has given up ground on both an absolute and relative basis. The weakness has accelerated this week – almost half of the Russell 2000’s 4%+ decline for October has come this week. Small-caps tend to see seasonal weakness ahead of presidential elections, and longer-term trends continue to favor small-caps.
Indexes Seeing Less Support Beneath the Surface – The NASDAQ 100 made a new high this week, but the broader NASDAQ Composite failed to provide confirmation and is in fact now trading below its 50-day average, joining the nearly two-thirds of its constituents that are doing likewise.
Leadership Rotation Ongoing – It might be too soon to conclude that the nascent strength seen in Transports (particularly relative to Industrials) in September has proven to be a false hope, but follow-through has been lacking. Strength out the Financials sector, however, continues to broaden, with the bank index moving to a new year-to-date high.
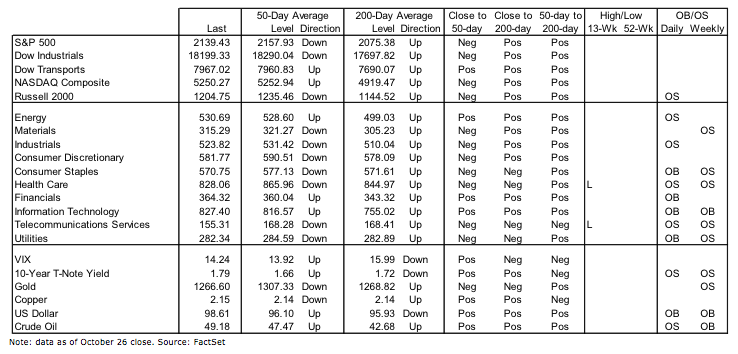
Stock Market Indicators
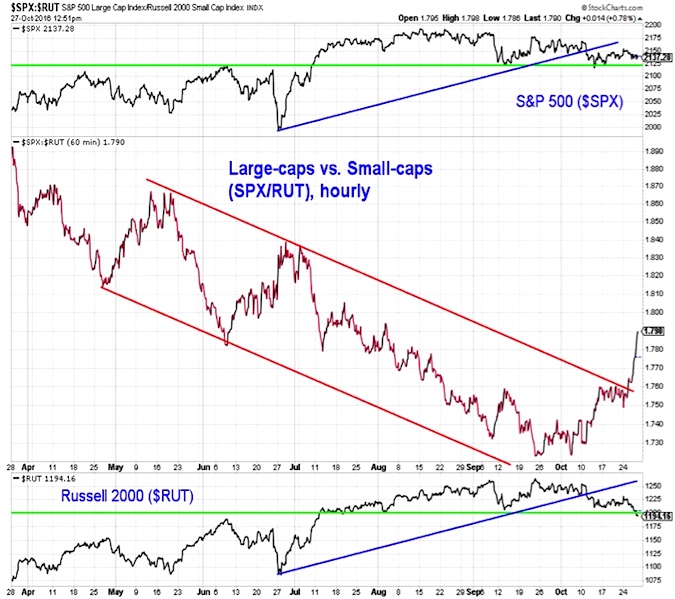
Large Caps vs Small Caps
The narrow trading range on the S&P 500 remains intact, with the September and early-October lows near 2120 continuing to provide support. The Russell 2000 (at the bottom of the chart to the right), however, has been unable to hold comparable support and is moving to a new month-to-date low. The most recent weakness has moved the large-cap/small-cap ratio out of the channel that has persisted since this spring.
The recent relative weakness out of small-caps is consistent with the presidential election pattern. The good news is that pre-election weakness from small-caps has historically been short-lived and followed by a small-cap leadership that carries into the first year of a new president’s term. In other words, weakness out of small-caps now may prove to be an opportunity for nimble investors.
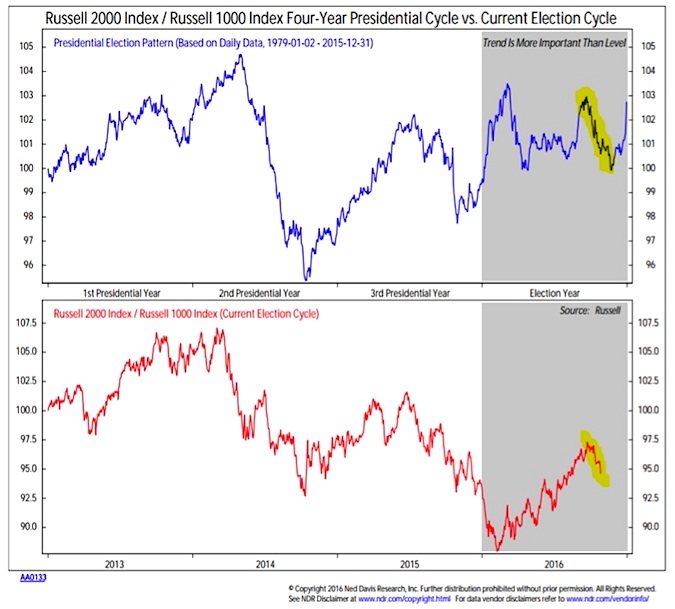
Stepping back, the longer-term trend favoring small-cap leadership remains intact. While industry group leadership from small-caps relative to large-caps has cooled recently, the improvement seen so far in 2016 has been impressive. From both a price and industry group trend perspective, small-caps have followed higher lows with higher highs versus large-caps.
continue reading on the next page…

: Showing Some Signs of Emerging Strength")
