A twist to Donna Summers’ sizzling 1979 hit, we investors are always lookin’ for the next hot stuff to trade.
Like a house draped in skeletal heat, finding picks in all the familiar places, might just put your P&L up in smoke.
This market appears about to shift.
I have read several stories since I began talking about the dollar, commodities and the historically low ratio between them and equities.
These articles support my theory that the time is getting closer for a major shift.
One particular story of interest, hypothesizes that the Trump administration, like others before it, will be behooved to devalue the dollar.
“If the President is unable to satisfactoriy adjust the trade terms with our partners, he could resort to a weak U.S. dollar policy.” – Michael Lewbowitz, right here on See It Market.
Based on what I am seeing concerning retaliatory measures by our allies, it seems plausible.
Furthermore, the devaluation of the Chinese Yuan serves as further proof the lengths countries will go to for tariff self-preservation.
Also out on Friday, May core PCE inflation numbers are up 2.0% year-to-year. Income is up nominally at .4% and the savings rate is up from 3 to 3.2%.
Core inflation at 2% is what the Federal Reserve’s target is.
Then, speaking of a house in flames, the predictions for the GDP numbers (Gross Domestic Product), indicate an economy that grew at 2% versus the earlier predictions of 2.3%.
Weighed down by the weakest consumer spending in nearly 5 years- think Granny Retail Brick and Mortar $XRT- this quarter versus the 4thquarter results (2.9%) is a first step in the recessionary direction.
Adding it all up, reasons to devalue the dollar, inflation at the Fed’s target and an economy projected to slow – So what do we got?
We got some hot stuff baby!
And we are moving closer to stagflation.
If reading this makes you feel like your money is swathed in skeletons, never fear.
There are always opportunities in every market condition.
Oil has been one place to park money. Looking back from June 2017 until now, oil has risen by over 63%!
This week, one crude oil ETF (USO) cleared the 200 week moving average for the fist time since 2014. Major trend reversal.
That puts oil high on the list of investment prospects for buying dips.
It’s also inflationary, which of course, leads us back to gold and other commodities.
The dollar to gold relationship is not one set in stone.
However, in the current market, gold has sold off for a few reasons.
In no order of importance, a strong dollar and strong equities market are two reasons. Plus, up until now, there have been zero concerns about growing inflation.
With oil reversing trends, is gold next? I think so, especially if the dollar in terms of UUP, the ETF, breaks down under 24.80.
We are also watching grains, which have been slaughtered this year. And sugar. Maybe the best bet to watch-sugar. An old school inflationary indicator.
Finally, I like to watch commodity rich country ETFs. Brazil ETF (EWZ), for example. Or India (INDA), of particular interest right now.
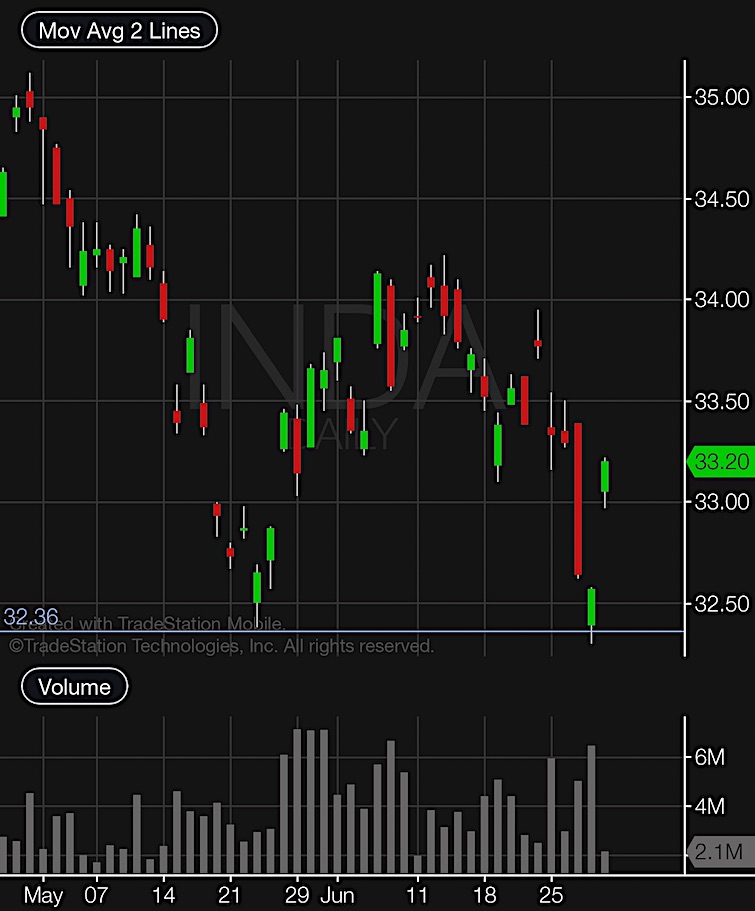
Check out that beautiful and potential double bottom at the 32.30 area, followed by a gap higher on Friday.
Last week I wrote, “You should be on both sides, with more weight to the long side until NASDAQ or Russell’s break the 50 DMA. Keep an eye on Transports and its 50-week MA as well.”
That still applies.
However, if you are wondering what to do for the official start of the second half of 2018, watch the emerging hot stuff and get ready to Flick your Bic!
S&P 500 (SPY) Back to an unconfirmed bullish phase confirmed. Barely. 271.50 pivotal 50-DMA. 274 resistance to clear. If cannot, and fails the 50 DMA, looking at 266.50 next.
Russell 2000 (IWM)164.14 pivotal with 161.83 the 50 DMA support and overhead resistance at 166.50.
Dow (DIA) 243.19 the 200 DMA could not hold. 239.25 the 50-week moving average support
Nasdaq (QQQ)169.58 the 50 DMA support. Big resistance at 173.75
Note that you can get daily trading ideas and market insights over on Market Gauge. Thanks for reading.
Twitter: @marketminute
The authors may have a position in the mentioned securities at the time of publication. Any opinions expressed herein are solely those of the author, and do not in any way represent the views or opinions of any other person or entity.


