The S&P 500 (NYSEARCA: SPY) closed above the Fibonacci retracement zone (between 38% and 62%) of the early 2016 to October 2018 long-term rally.
The momentum line on Market Forecast spiked again to extreme high and near-term line set to produce a bullish near-term low.
The current intermediate posture is weakly bullish. Usually, the intermediate line will make a run towards the chart’s midpoint from low levels where is experiences a hiccup. Low Market Sentiment sets up for decent long-term returns once bullish trend returns.
The S&P 500 is still well below 200-day SMA and can find some near-term resistance at its 50-day SMA, which is typical of moves coming off extreme lows below the 200-day SMA. In fact, past precedent suggests there could be a new divergent low formed within the next couple months after hitting short-term resistance before longer-term rally begins
The S&P 500 is testing 17-day EMA. Next stage will be for a test of the 30-day SMA where the next near-term high may be for producing the expected intermediate hiccup as seen is prior examples shown in the video.
It’s noteworthy that the S&P 500 closed above last week’s high and is trading near the 4-week range’s midpoint. This midpoint will be gradually moving lower as the 4-week high starts moving lower. The 4-week range remains above the 14% mark of the high. This is a strong level that points to higher moves.
Subscribe to the Market Outlook daily email list to get the daily and weekly overbought and oversold Market Forecast clusters watchlists for the S&P 500.
Weekend Market Outlook Video – Week of January 7:
Below are additional bullet points of market items discussed in this weekend’s video:
- Volume has dropped off, which is completely normal for bounces off capitulation-types drops.
- ATR is at high levels, which opens the door for a failure of the S&P at its 200-day SMA though there have been over times (2010 and 2011) where stocks broke through with a “golden cross” after similarly high ATR levels.
- Volatility (INDEXCBOE: VIX) is dropping sharply after the Christmas Eve surge to 125% of $VIX3M but still sits in the bearish zone, which suggests more short-term volatility until it moderates back down below its “neutral” zone.
- Crude oil and commodities are rising along with stocks as these asset classes are producing technical bounces off extreme oversold levels.
- 10-year Treasury yields may have found support at 2.6% – its old highs in late 2016-early 2017.
- Dovish Fed comments helped lift risk appetite but strong employment report reduced the growing odds of a 2019 rate cut (from 50% to 25%). The odds for a single rate hike in 2019 are still close to zero.
- Sharply falling inflation expectations are weighing on interest rate hike expectations while today’s strong economic data weighed on rate cut odds.
- Safe haven sectors are lagging, as expected, during the bounce off the Christmas Eve low. Technology, Consumer Discretionary and Communication Services are leading the rebound. Energy, Materials and Industrials benefit from a weakening dollar.
- Bullish trade example in Consumer Discretionary sector. Stock has been on strong downtrend and showed bullish breakout signals today.
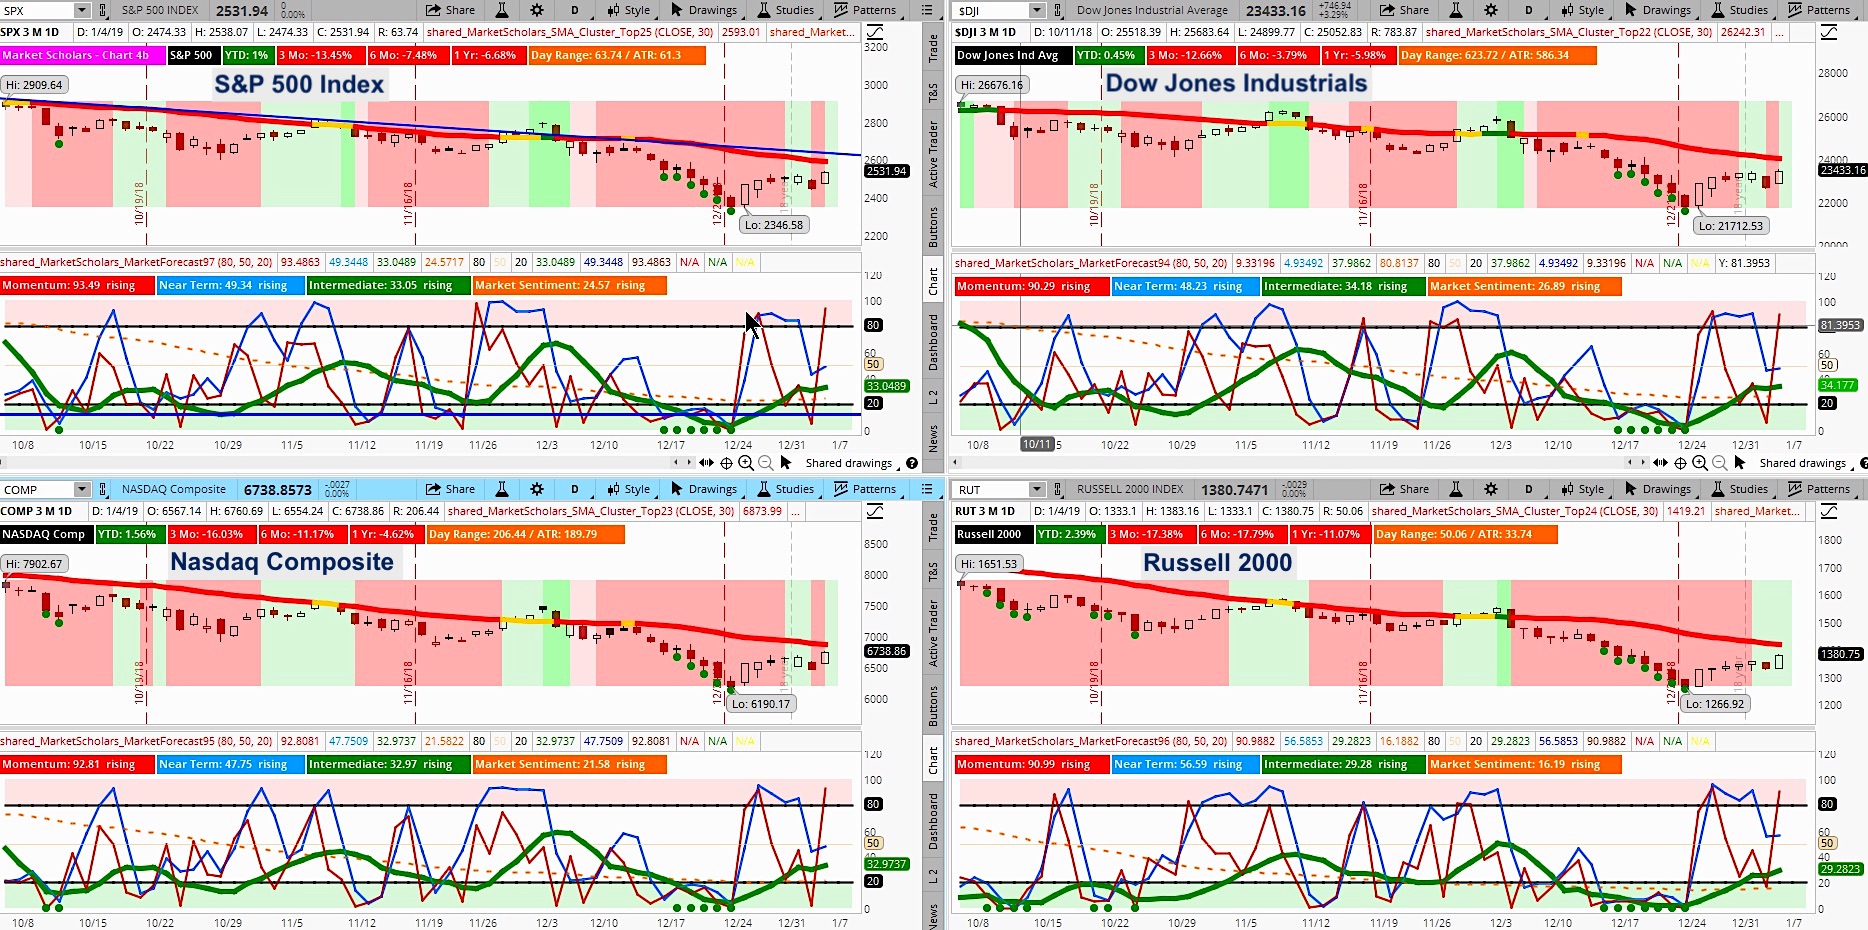
I’ve also attached two charts that you can use if you like and however you think it’s best. One is for the daily trade idea and the other is the Market Forecast for the 4 indexes.
Twitter: @davidsettle42 and @Market_Scholars
Any opinions expressed herein are solely those of the author, and do not in any way represent the views or opinions of any other person or entity.


