On November 19th I wrote an article titled “Maximizing Returns with Wayne Whaley’s “TOY barometer”. If you read that article, then you should be aware that yesterday marked the end of Wayne’s TOY Barometer seasonal period.
If you haven’t read that article, you can read it here. Wayne’s work is fascinating.
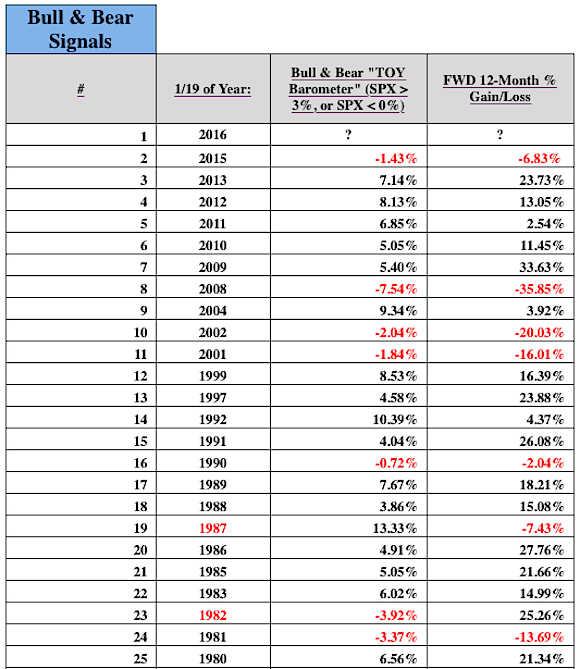
The S&P 500’s TOY Barometer for 2015-16 finished at -9.60%. This is the worst TOY Barometer in the history of the stock market index dating back to 1950. The previous all-time worst TOY barometer was -7.54% from… 2007-08. Speculatively speaking, you can add this to the list of evidence that suggests it’s 2008 all over again.
Now, if you’ve ever doubted the potential validity of Wayne Whaley’s TOY barometer tool, keep in mind that 2014-15 was also a “bearish” TOY barometer which suggested average returns for the S&P 500 over the forward 1-year period of -7.38%. With today’s close at 1.881.33, the S&P 500 declined 6.83%. Not too bad, huh?
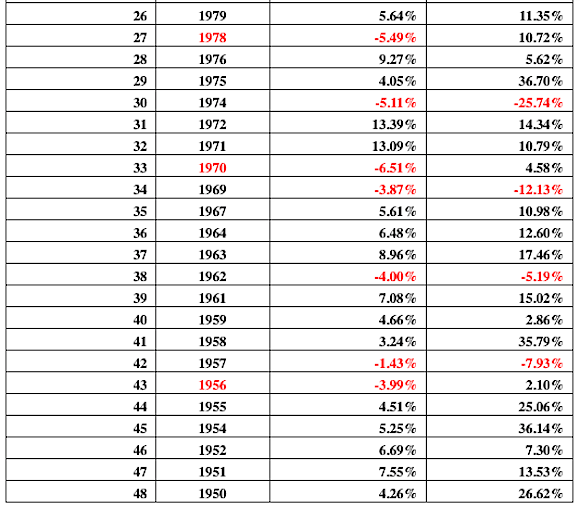
Name one other Wall Street analyst whose work called the last one year for the S&P 500 this accurately. Combined bullish and bearish TOY Barometer signals have now accurately forecasted the forward 1-year return from signal date for the S&P 500 in 42 of the last 47 instances, which is like shooting 89.36% from the free throw line. The last year the TOY Barometer was incorrect was 1987.
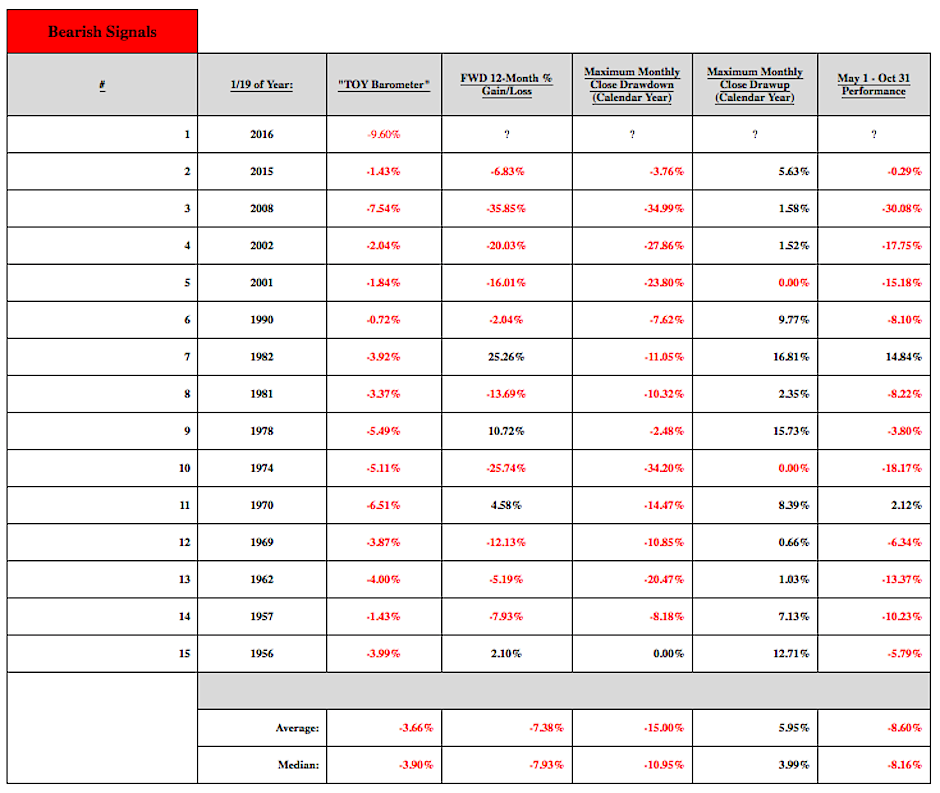
Where are we now? For starters, we have back-to-back bearish TOY barometers for the stock market. This has happened only four other instances for the S&P 500 Index since 1950. It’s hard to glean anything from something that’s happened only 4 times the last 66 years, and that’s what the data shows. The second year of these back-to-back sequences include one fantastic year for the stock market (1982), one horrible year (2002), one good year (1970) and one bad year (1957).
It’s also important to note that the magnitude of a bearish TOY barometer does not suggest an increasing magnitude of negative returns for the S&P 500. Of the seven worst bearish TOY barometers in history, four of them actually went on to produce positive forward 1-year returns from signal date (1982, 1978, 1970, 1956).
What we can observe is all of the calendar years in which a bearish TOY barometer occurred, and identify the historical behavior of the S&P 500. Using monthly closing prices, I’ve identified the maximum monthly close drawdown and drawup from January’s monthly closing value for the S&P 500. Of the 14 bearish TOY Barometers, in only one instance did the January monthly closing price of the S&P 500 mark the lowest monthly closing price of the calendar year (1956). This would lead me to believe January’s close is probably not going to be the lowest monthly close of 2016.
Therefore, if history is any guide, things could get much nastier as the average monthly close drawdown is -15.00%, with the median coming in at -10.95%. Assuming January finishes the month at 1,900, this would target a 2016 monthly closing low between 1,615-1,692. This would likely accompany a retest of horizontal support at and around ~1,575, something a long-term monthly chart appears to be begging for. That would be quite the battle between buyers and sellers.
In the optimistic scenario, the average monthly close drawup is 5.95% and the median is 3.99%. Assuming January finishes the month at 1,900, this would target a 2016 monthly closing high between 1,975 and 2,013. Also, only 2 of 14 bearish TOY Barometers didn’t experience a monthly drawup, therefore it’s likely January’s monthly close isn’t the highest monthly close of 2016. Perhaps the bounce we’re all looking for will actually come to fruition. In speaking with Wayne last week he also pointed out the S&P 500’s bearish performance during the seasonally unfavorable period between May and October during bearish “TOY barometers”. The average market return over this six-month period for the index is -8.60% and the S&P 500’s been positive in only 2 of 14 instances. Perhaps we’ll bounce into May and then “sell in May and go away”. click to enlarge
continue reading on the next page…


 Testing Important Price Support")
")
