We are seeing continued signs that the economy is pumping the brakes.
Another one came this week as Walmart reported lackluster earnings, causing its stock to plunge. Yikes!
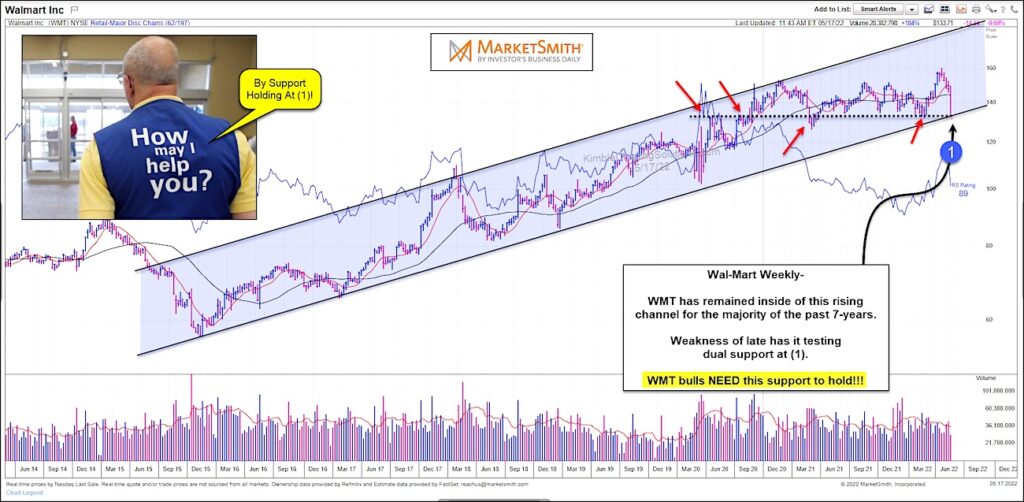
This freewill is quite evident on the long-term “weekly” chart of Walmart (WMT) below.
As you can see, Walmart has been trading inside a rising channel for the majority of the past 7 years. It is currently testing the bottom of its up-trend channel at (1).
This support is made even more important by the fact that this price area has been a support/resistance toggle for the past 2 years.
Not only do WMT stock bulls need this support to hold, but perhaps all of everyday America is hoping that this support holds. Seems we should all pay attention. Stay tuned!
$WMT Walmart Long-Term “monthly” Chart
Note that KimbleCharting is offering a 2 week Free trial to See It Market readers. Just send me an email to services@kimblechartingsolutions.com for details to get set up.
Twitter: @KimbleCharting
Any opinions expressed herein are solely those of the author, and do not in any way represent the views or opinions of any other person or entity.


 Ready To Break Out?")

