Back in December of 2015 I blogged about a tradable rally, potentially, for Walmart stock (NYSE:WMT).
In that post, I decided to spend some time demonstrating why this setup was important and why/how we can use technical analysis using pattern recognition.
Below I will recap the setup, what happened, and try to show the power of patterns based in math/cycles. For the record, this is NOT about me. I’ve said this many times before, but remember that sometimes they work and sometimes they don’t (see failure of Under Armour chart pattern). It’s about probability… and finding areas of interest that have good risk/reward setups.
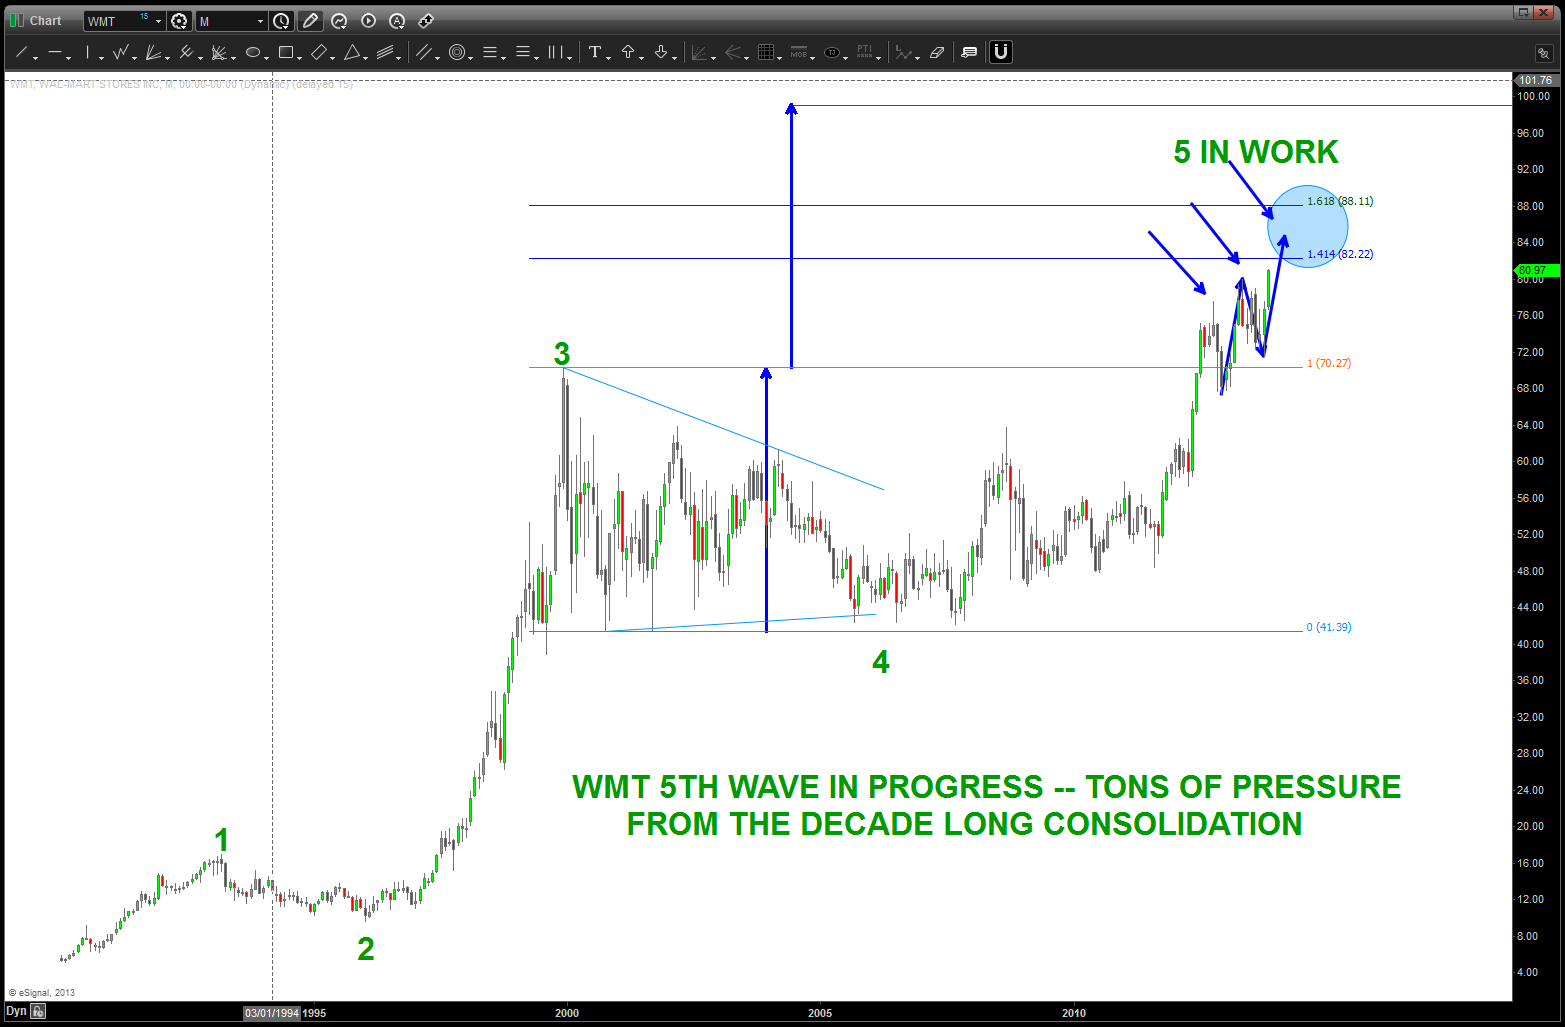
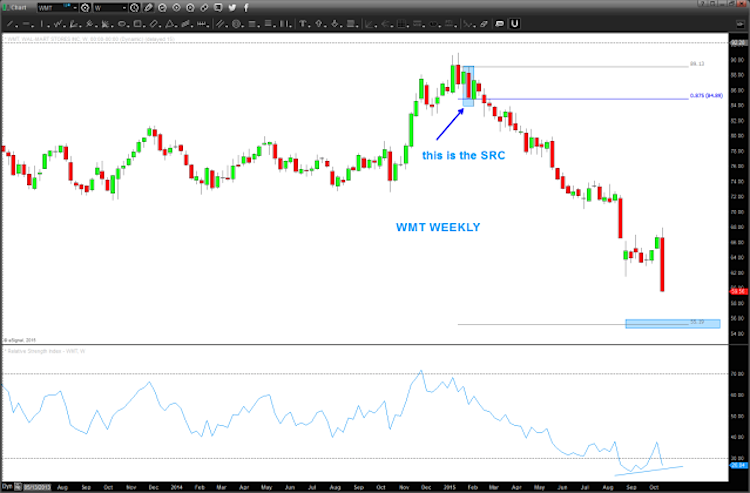
Now on to Walmart (WMT) and how chart pattern recognition highlighted the top, what could be a longer-term bottom, and its recent trading pivots. Let’s start with the top back in early 2015.
In the chart below you can see the much acclaimed breakout from the consolidation level. It’s rather ‘easy’ to see that this consolidation took the form of a triangle and, usually, triangles are forewarning the ‘end of a move’ once they are broken. With that in mind, it was time to look for targets. When seeing potential 5th wave movements completing, be comfortable with a zone of price. Sometimes you can nail it on the head BUT ultimately, waiting for a monthly signal reversal candle is the best way to hedge probability in your favor.
Once it began correcting, it was time to figure out where it could be headed…
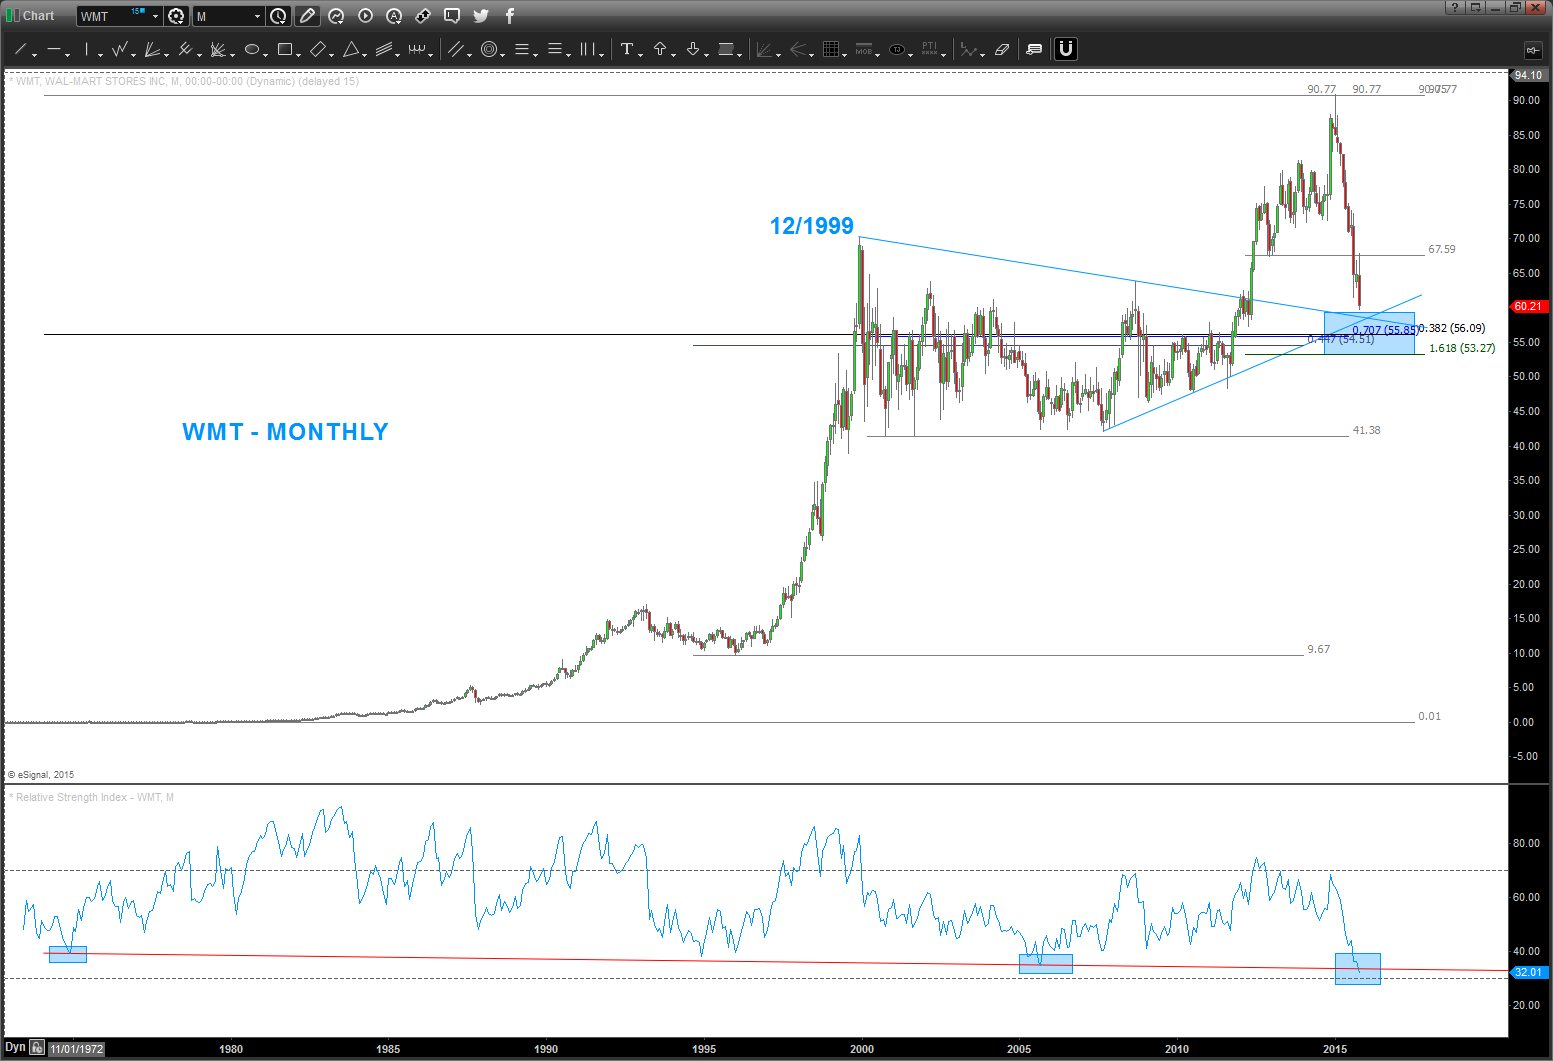
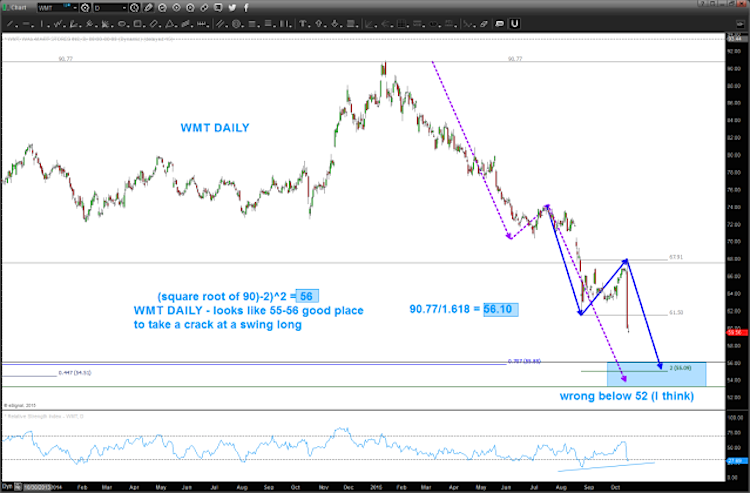
Okay, let’s discuss the 3 charts above. Simply put, there was a TON of geometry and math coming into play within the 55-56 region.
- Note the intersecting trend lines that defined the consolidation area … they me together at our target zone.
- Note the retracement levels all coming together
- Note the long term Monthly RSI support zone
- Note the purple and blue projections
- Note the square root targets
- Note the numerology of dividing the high by 1.618.
- Folks, just a ton of stuff coming together .. why is this important because of the “wrong below 52 I think.”
- Here is where we defined our risk. Basically risking 3 to make 20 or roughly 7:1 probablitiy.
Then came the rally…
Using the ‘basic’ polarity principle and the fact that it was so oversold on a monthly – it seemed plausible that it would rally up into the area indicated in the chart below.
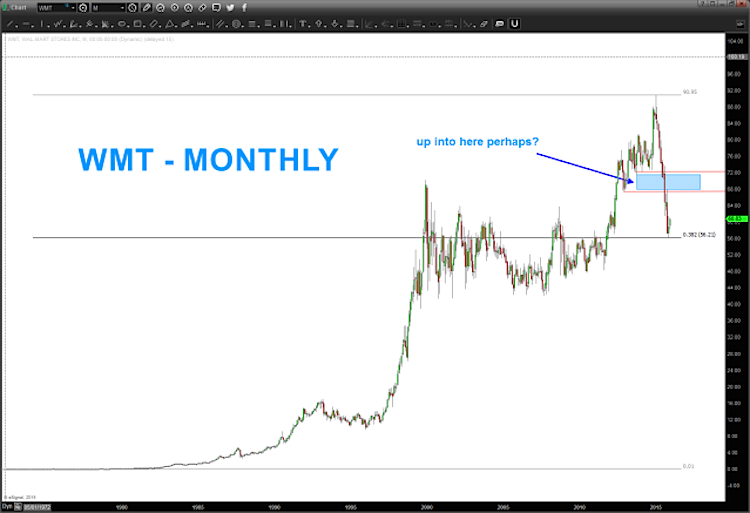
So where to now?
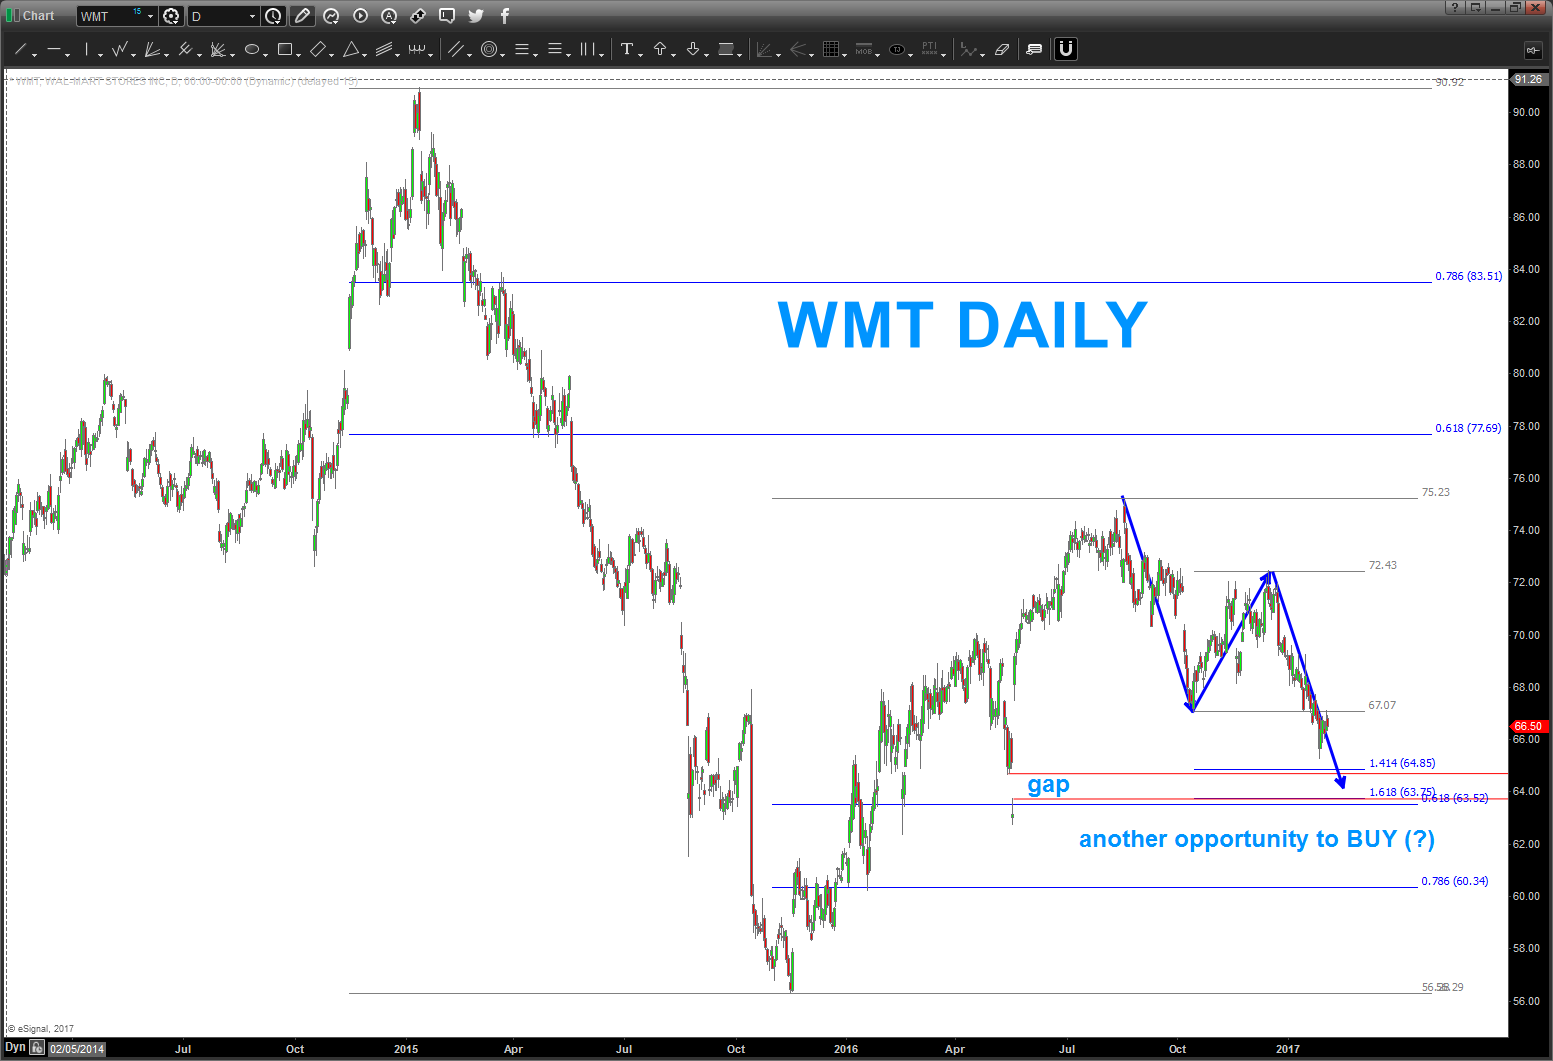
As shown, the stock did rally up into the zone of resistance. But notice, a clearly defined pattern has emerged and (here’s the key) the pattern completes right on top of an open gap. That’s USUALLY a very powerful indicator that, at a minimum, a bounce will occur. The 63-64 zone is a very nice BUY PATTERN. If we fail there, then it will open up 60 and, perhaps, a further degradation of the iconic stock WMT.
Note, there was ZERO fundamental analysis ever conducted on this stock. Using the skills of technical analysis, pretty much every pivot was seen – BEFORE THEY WERE HIT – and the stock has been bouncing around VERY predictably to the tenants of technical analysis.
Thanks for reading.
Twitter: @BartsCharts
Author does not have a position in mentioned securities at the time of publication. Any opinions expressed herein are solely those of the author, and do not in any way represent the views or opinions of any other person or entity.

: Showing Some Signs of Emerging Strength")
