“Ted Williams described in his book, ‘The Science of Hitting,’ that the most important thing – for a hitter – is to wait for the right pitch. And that’s exactly the philosophy I have about investing – wait for the right pitch, and wait for the right deal. And it will come… It’s the key to investing.” – Warren Buffett
Many investment managers tempt investors with historical returns by using them as indicators of future return expectations. Unfortunately, even if they are clairvoyant, a buy and hold strategy based on a “known” long term return is likely not in a client’s best interest.
Buy and hold strategies that are solely focused on a long-term total return fail to consider the current state of valuations, the risk reward profile, and therefore the path of returns the market may take between now and the future. Importantly, they also ignore investor circumstances and whether he or she is a young worker in savings mode or a retiree who must draw living expenses from their account.
Even with a “known” return, it may be comforting to think one can buy and hold without any reservations. The reality is that, in many circumstances, such a strategy leaves a lot to be desired. On the path between today and tomorrow, there will inevitably be periods where returns are well above original expectations accompanied by a lower level of risk. There will also be periods where returns are lower than expected and the risk is greater.
This paper is theoretical in nature, but the simple message underlying the article is, as stated in the opening quote, you do not have to swing at every pitch. Patience rewards the prudent.
Destination vs Path
Let’s take a time machine back to January 1st2005. Given that we are coming from the future, we know the following facts about the S&P 500:
- January 1, 2005 price: 1181.41
- 2015 Cyclically-adjusted P/E (CAPE): 26.49
- Earnings growth 2005-2015: 7.68%
- Dividend yield 2005-2015: 2.04%:
- Dec 31, 2015 price: 1524.53
- Annualized total return 2005-2015: 7.59%
In 2005, most investors would have considered the prospect of a 7.59% annualized return as favorable on a nominal basis as well as in comparison to U.S. ten-year Treasury notes, which yielded 4.22% at the time. Armed with that information, we guess that many investors would elect to buy and hold and earn 7.59%.
Let’s add a few more facts to the story. In January 2005, market valuations as measured by CAPE were at 26.59, which was a premium of 67% to the average (15.93) up to that time using data since 1900. In 2005, investors knew that if prices reverted to valuation means over the course of the ensuing ten year period, with earnings and dividends constant, the total return over the entire period would be -0.21%. Such a return compares poorly to the 4.22% annualized, risk-free returns offered by the ten-year U.S. Treasury note in 2005.
As it turned out, CAPE valuations did revert to their mean and even slightly below by March 2009. However, they expanded afterwards and by 2015 closed at levels nearly identical to 2005. The variation in the multiples investors were willing to pay for earnings (CAPE) factored largely into returns from 2005 to 2015. As a result, the actual path of annual returns was quite different from the straight line 7.59% many were expecting.
For anyone who was fully invested, and like today many were, that volatility imposed terrific stress. Furthermore, because of the reversion to the mean, there were opportunities to grow wealth at a faster rate than 7.59%, but it required having some cash on hand in order to take advantage of those opportunities.
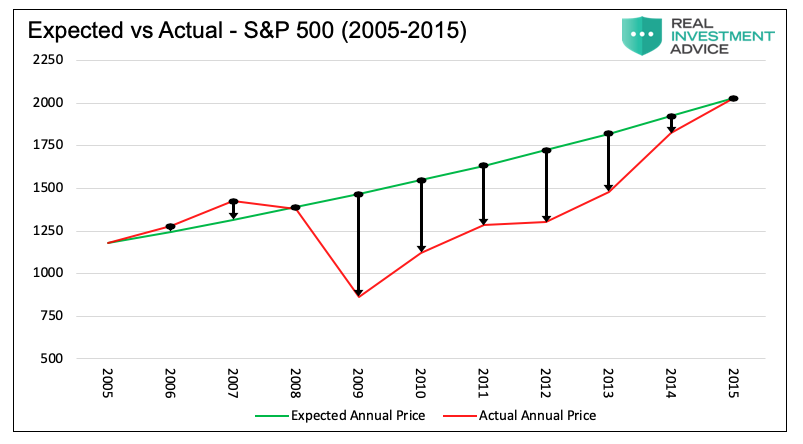
The following graph compares the expected price of the S&P 500, assuming a market return of 7.59% every year for the ten-year period, to actual prices. Despite the same final price, note the wide price differences that occurred over the period. These divergences represented opportunities to change your investment posture, to increase or reduce risk, and better your realized total returns.
The following illustration adds bars to the graph above to highlight the expected returns in 2005 and the revised annual expectations in each ensuing year.
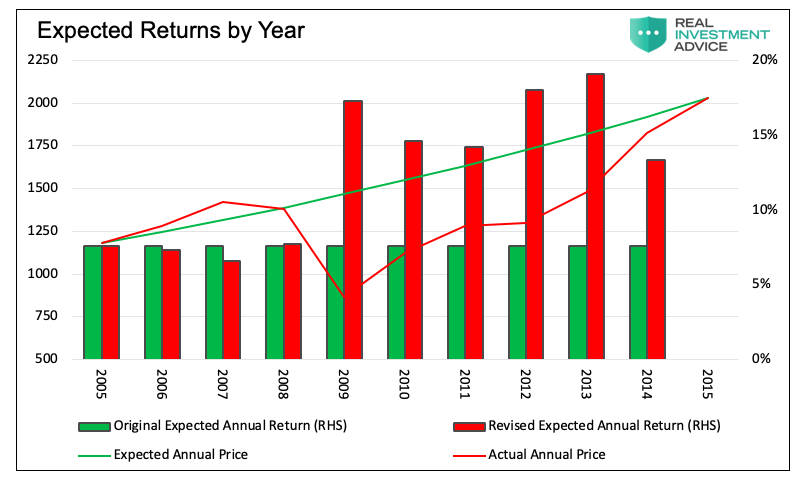
With the benefit of hindsight, we know an investor did not need to settle for the 7.59% guaranteed 10-year annualized return in 2005. In 2009, the expected return until 2015 would be more than double the original 7.59%.
Let’s consider an alternative way an investor might have invested over the ten year period.
The following table and graph compares a hypothetical, actively-managed portfolio versus a rigid buy and hold portfolio. The active investor, in our example, used a more conservative allocation when equity valuations were high. Conversely, when valuations normalized, he takes more risk by reallocating to a predominately equity-oriented portfolio.
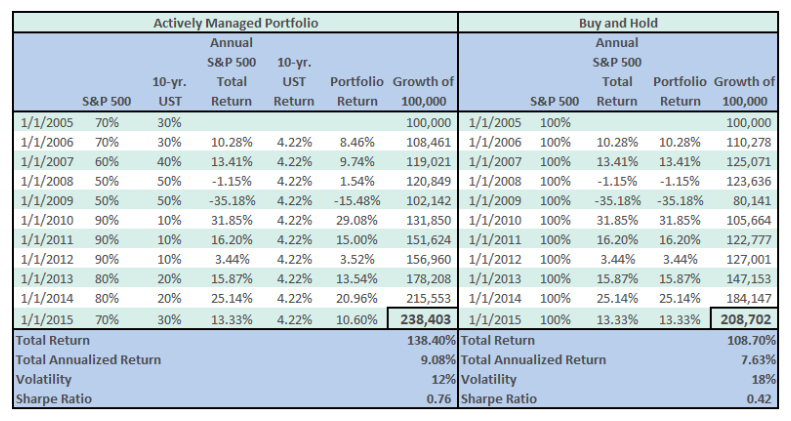
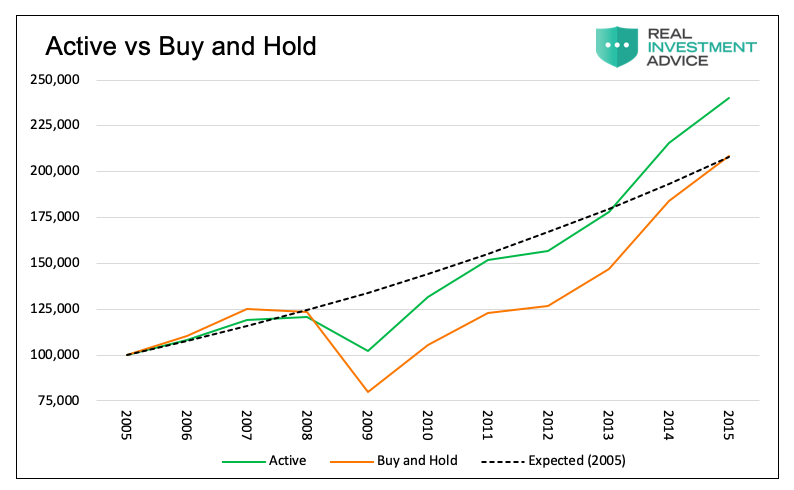
As shown in the graph above, the actual dollar returns of the active versus buy and hold portfolios differed from the dotted straight line expected return. The table above the graph shows that the active portfolio beat the buy and hold portfolio by approximately 1.50% a year, and importantly, did so while taking less risk. The Sharpe ratio in the table, measuring returns as a percentage of risk, clearly favors the active approach.
The premise here is illustrative, and we urge you not to take the data too literally. We could have made the active allocations look a lot better by reducing equities to zero before the financial crisis, or we could have made them worse by not increasing the allocation to equites in the post-crisis era. The point of this exercise is not to play Monday morning quarterback, but to provide a simple example of how a more thoughtful active approach can use valuations to reduce risk andincrease returns.
The Path for the Next Ten Years
In Stocks versus Bonds: What to own over the next decade,we showed that under three optimistic scenarios in which valuations remain historically rich but mean revert to a still high level, (CAPE 24.80 = +1 standard deviation from the mean) annualized equity returns are likely to range from 0.71% to 4.62%. Under what we deem to be an average scenario, investors with a ten-year holding period should weak total returns. As such, a buy and hold strategy currently provides poor return expectations when compared to historical equity returns.
Given that the odds favor CAPE regressing towards its mean, or possibly below it, within the next ten years, logic and reason argue that better opportunities likely lie ahead. Why not take the conservative approach today when valuations stand at historically high levels? Doing so may allow you the opportunity to swing at the fat pitch tomorrow.
By some measures, as shown below, equity valuations are at levels never witnessed in the modern era. Whether “this time is different” or valuations are sharply out of line and will correct, is up for debate. We simply urge you to consider that there are potential future opportunities that can only be seized by exhibiting caution today.
Summary
The point being made here is essential; risk management is generous. Based on the past 100 years of market data, there is no evidence that long-term returns are penalized by taking a defensive investment posture at high valuations.Investors today do notneed to buy and hold stocks and remain heavily invested when expected returns are paltry. The historical record, though imprecise, affords an excellent map for navigating and managing risk.
Patience is an investor’s friend, and time has a habit of delivering better opportunities to those inclined to exercise it. Each investor can determine his own “strike zone” and is well-served to exercise patience until a fat pitch comes along.
Twitter: @michaellebowitz
Any opinions expressed herein are solely those of the author, and do not in any way represent the views or opinions of any other person or entity.


