This article is a collaboration between between Arun Chopra (@FusionPtCapital) and Aaron Jackson (@ATMcharts).
There’s a lot of uncertainty about Europe’s economy and the never ending Brexit saga. Germany, the world’s 4th largest economy, has some of the weaker economic data in the developed world.
Let’s take a 10,000 foot view of the key European markets. Here’s a summary:
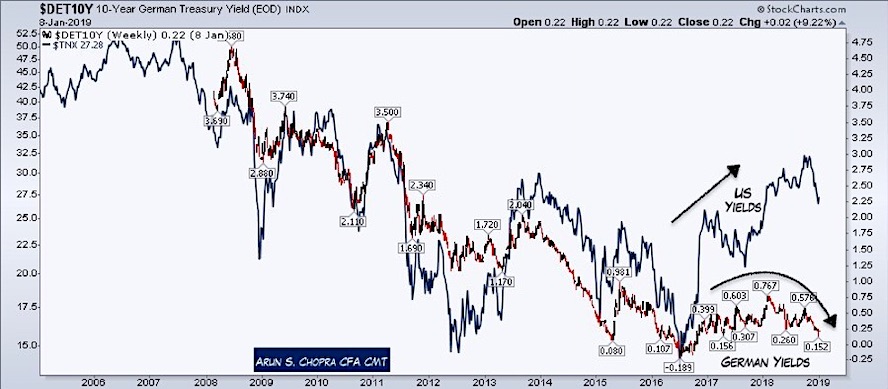
– Germany’s treasury yields have diverged from U.S. yields.
– Decade long uptrends in European Indices have ended and are at best in ‘no man’s land’
– The Euro is in a long-term downtrend and it hasn’t helped equity prices in the last year
Germany’s treasury yields completely decoupled from the US in 2018 and has led them lower. They just can’t stay off the mat even though their 10 year is yielding next to nothing.
Germany’s DAX Composite lost the trend from the 2009 low in Q4 and notably failed to hold over the 2015 high. Last fall this completed a topping pattern with a price objective of 10k.
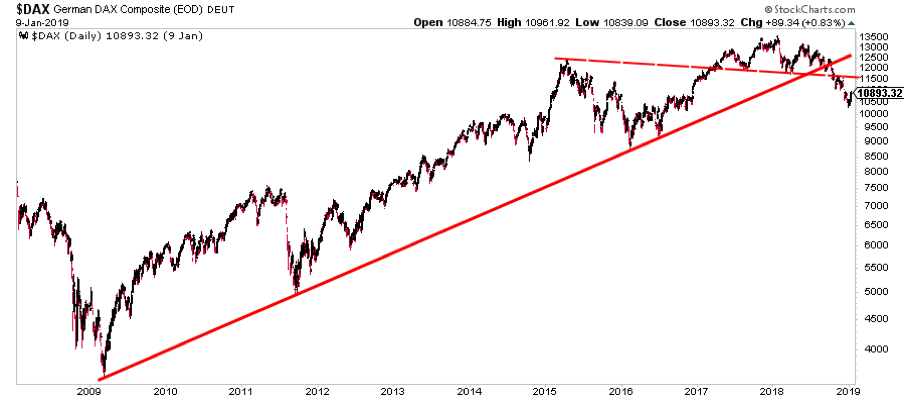
Price has gotten pretty close to the target. In the long term, levels to watch include a heavy support zone around 9,000ish below and on the upside there’s a sell confluence around 11,500. For now, there’s no dominant long term trend while the shorter term trend is still lower.
The STOXX 600 is a broader representation of the Eurozone, think of it as Europe’s S&P 500. Unlike the S&P 500 or the DAX, this hasn’t been able to break through the 2007 high. Or the 2000 high for that matter. That’s very notable global relative weakness.
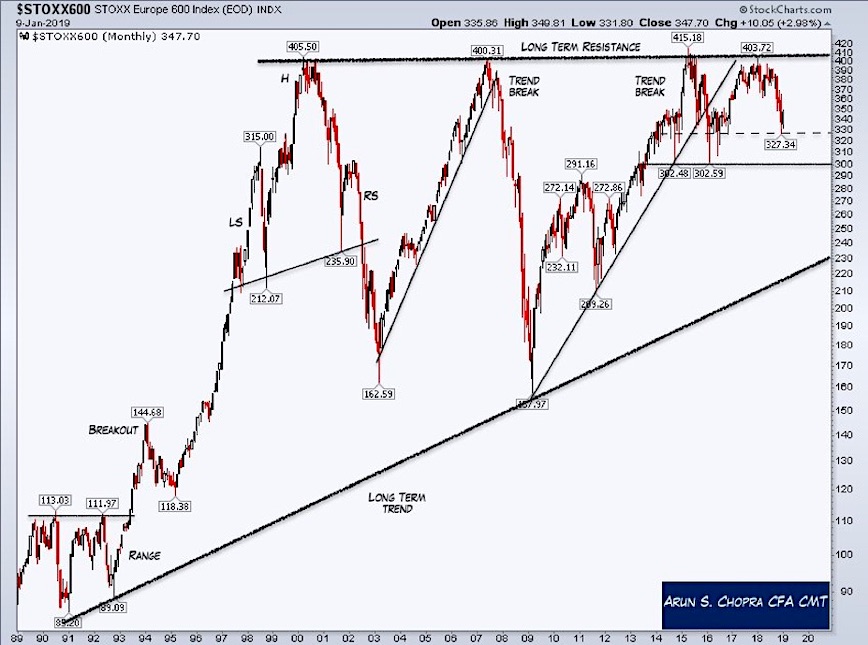
If you like trading ranges, this index is for you. A two year range has developed within a 20 year range. So again there’s not intermediate or longer term trend and the short term trend is lower. A break below the 300 area eventually brings a test of trend support from 1990.
The final piece of this puzzle is the Euro. It’s trended lower for a decade with the most recent down leg starting in 2018.
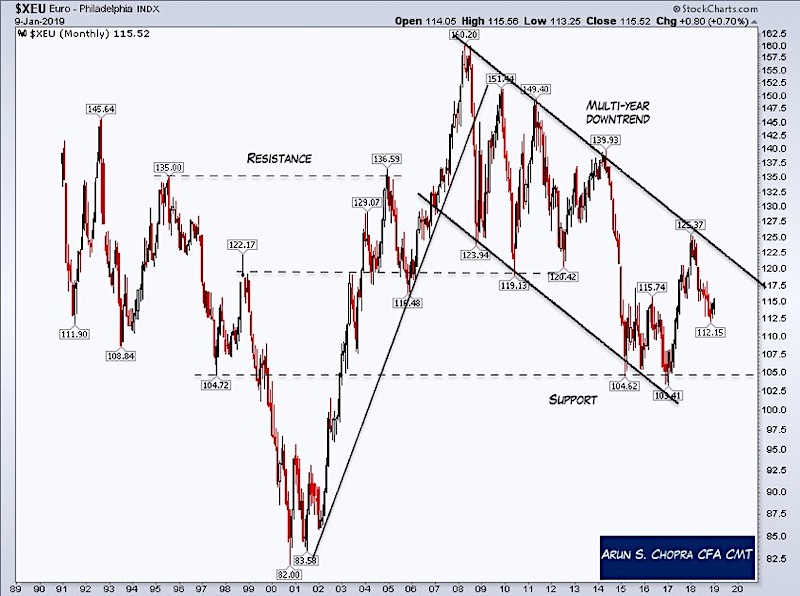
It’s noteworthy that the current decline hasn’t been enough of a buoy to keep equity prices from falling. The dynamic between the euro and stock prices is worth watching in future quarters as it unfolds.
The short term trends speak volumes. European yields, stocks and currencies are all falling simultaneously. The damage has been enough to end long term uptrends in stocks and there’s no clear evidence that things are improving. Thanks for reading and trade ‘em well!
The authors may have a position in the mentioned securities at the time of publication. Any opinions expressed herein are solely those of the author, and do not in any way represent the views or opinions of any other person or entity.


