The S&P 500 Index is jumping once again to new highs — but is the volatility market sending a non-confirmation warning?
A few weeks ago, we wrote about a curious divergence between the stock market and the volatility market.
Specifically, while the stock market, e.g., S&P 500, was hitting a new 52-week high, the volatility market, e.g., the VIX, was well off of its lows — and trending higher.
As we noted in the piece, this type of “divergence” from the two markets’ normal inverse relationship had only been seen a handful of times over the prior 2 decades — with all observances occurring near cyclical or significant market peaks. We bring it up again now because of the occurrence of another similar divergence at yesterday’s new high in the S&P 500.
Specifically, the S&P 500 rose by more than 0.75% to a new 52-week high. Yet, at the same time, the VIX closed nearly 30% off of its 52-week low — and up on the day. As in the case of the divergence in our previous post, precedents were few and far between in the past 18 years. In fact, the only days meeting similar criteria since 1999 were the following:
- 3/23/2000
- 4/25/2007
- 1/17/2018
- 8/27/2018
- 9/20/2018
Now, in case you don’t recognize the significance of this particular list of dates, the following chart should provide ample color.
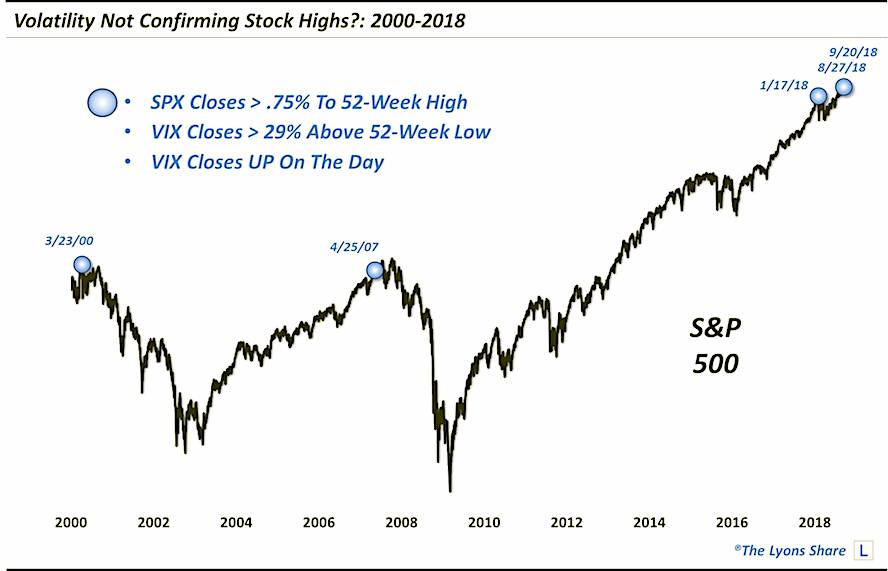
Obviously, over the past 18 years, this presence of this signal has been extremely inauspicious for stocks. In fact, it has only occurred near the cyclical tops in 2000 and 2007 and at the intermediate-term top this past January. Likely no further amplification is necessary there.
However…
Like the recent post, there is a “rest of the story”, e.g., the period before 2000. If we extend the chart back prior to the past few decades, and back to the beginning of the VIX in 1986, we find several more, less threatening occurrences.
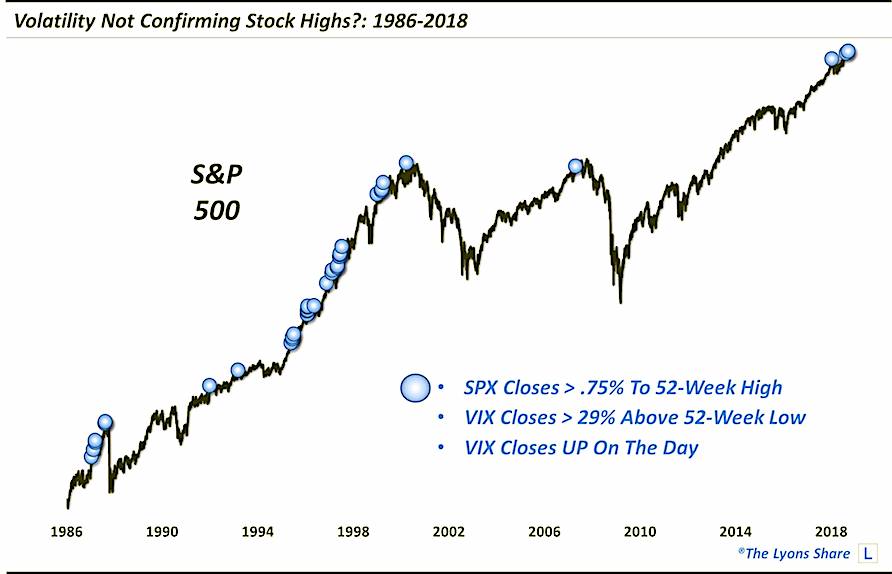
As we stated in the prior post, the interpretation of the meaning of this stock/volatility divergence likely depends on one’s view of the current market environment. Are we in a roaring 1980’s-90’s bull market again, or are we still in this two-way post-2000 market? The answer to that question probably holds the key to how concerned investors should be about this signal.
Twitter: @JLyonsFundMgmt
The author may have a position in mentioned securities at the time of publication. Any opinions expressed herein are solely those of the author, and do not in any way represent the views or opinions of any other person or entity.


