 The CBOE Volatility Index (or VIX) is often referred to as “the Fear Index” for the measurement of crisis or complacency its calculation is popularly thought to convey. In persistent low-volatility regimes like 1992-1995 and 2005-2007, though, it is equally well-regarded as an index of frustration where long periods registering closes beneath 12 (and often below 11) ceaselessly confound market contrarians looking for some reversion of sentiment.
Not surprisingly, 2013 is turning into another such period – only the third in history of the VIX – where closes around 11, 12 or 13 aren’t moments of bearish capitulation or bullish hubris, but the norm.
Can the VIX still act as an effective tool in this low-vol environment?
Depending on your market and methodology, there are many ways to answer “yes” to this question. Whether one is buying or selling volatility outright, or using VIX simply as an analytical input, recognizing the baseline relative to the current market environment is paramount.
For 2013, 12-12.5 has acted as a floor for volatility from all but one of the year’s noteworthy pullbacks (such as they are) have broken down. In the VIX analysis chart below, the VIX itself has been removed, but it’s daily closes below 12.5 (solid vertical white lines) and below 12.25 (dashed vertical white lines) are noted over the S&P 500 (SPX). The number above the S&P is total upside covered (the maximum adverse incursion) following the first close below 12.5 before the index turned lower. The number below SPX is the depth of the pullback low as measured from that initial close.
VIX Analysis: Closes Below 12.5 and 12.25 on the S&P 500 (click image to zoom)
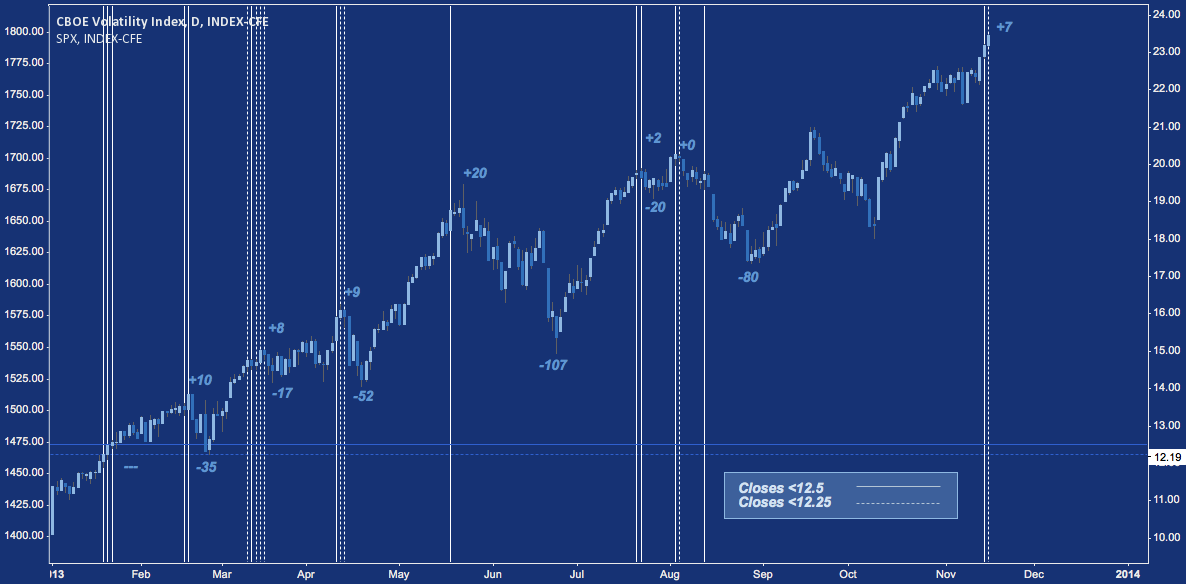
These pullbacks, when they occur (January 2013’s 3 closes below 12.5 didn’t spark any pullback at all) have been miniscule, averaging 58 points or -3.2% at the S&P’s current level. That’s hardly worth consideration except to more active traders.
Nonetheless, in a market begging the question of when (even whether) the next pullback will come given the Fed’s perceived permabid and positive seasonality, it’s worth noting: on Thursday and Friday VIX posted two consecutive closes below 12.5 for the first time since the early August highs (preceding a -4.8% correction). SPX finished the week 7 points above Thursday’s initial <12.5 close, whereas the average adverse incursion this year has been +8 points, and the greatest has been +20.
Again, because of the year’s precedent it’s pitifully small, but then that’s all a VIX stuck in a low-volatility regime is going to be willing to give. Assuming a high on Friday’s close and given the pullback average, on this basis SPX could see a correction of 65 points, perhaps signally a test of the 09/18-09/19 post-FOMC highs at 1730.
Taken in tandem with the “signal” given by completion of two of SPX‘s up-legs Friday (read more about that here), swing traders, day traders and any under-performing dip-buying PMs may wish to take note: even if it is only a 2013 status quo pullback.
Twitter: @andrewunknown and @seeitmarket
Author holds net short exposure to Russell 2000 at time of publication.
Any opinions expressed herein are solely those of the author, and do not in any way represent the views or opinions of any other person or entity.


")


 Ready To Break Out?")
