In early September, we warned readers that Utilities were breaking down and that this would have an adverse effect on the stock market.
Since then the breakdown has become more pronounced. And stocks have been under pressure.
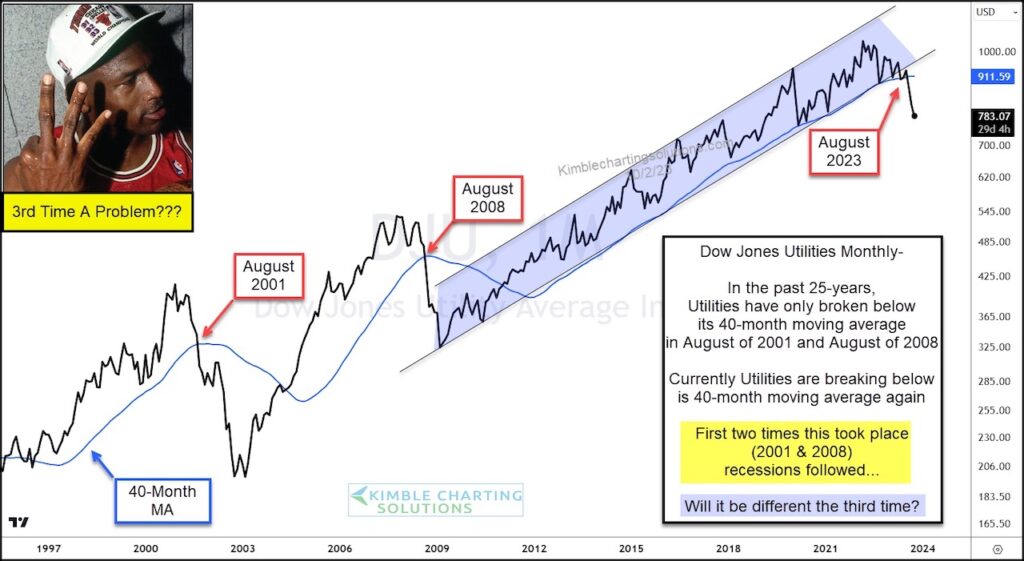
Today we provide an updated “monthly” chart of the Dow Jones Utilities Index, highlighting the clear breakdown below its uptrend line and 40-month moving average.
Historical Precedent
The Dow Jones Utilities Index has broken below its 40-month moving average only 2 times in the past 25 years. And both times recessions followed.
This marks the 3rd time in 25 years that Utilities have fallen below this moving average line…. different results this time? Stay tuned!
Dow Jones Utilities Index “monthly” Chart
Note that KimbleCharting is offering a 2 week Free trial to See It Market readers. Just send me an email to services@kimblechartingsolutions.com for details to get set up.
Twitter: @KimbleCharting
Any opinions expressed herein are solely those of the author, and do not in any way represent the views or opinions of any other person or entity.

 and Russell 2000 (IWM)")


 and Russell 2000 (IWM)")
