It’s been a rough go around for stocks and investors. But will it get worse before it gets better?
Let’s turn to Joe Friday for “The facts, Ma’am. Just the facts.”
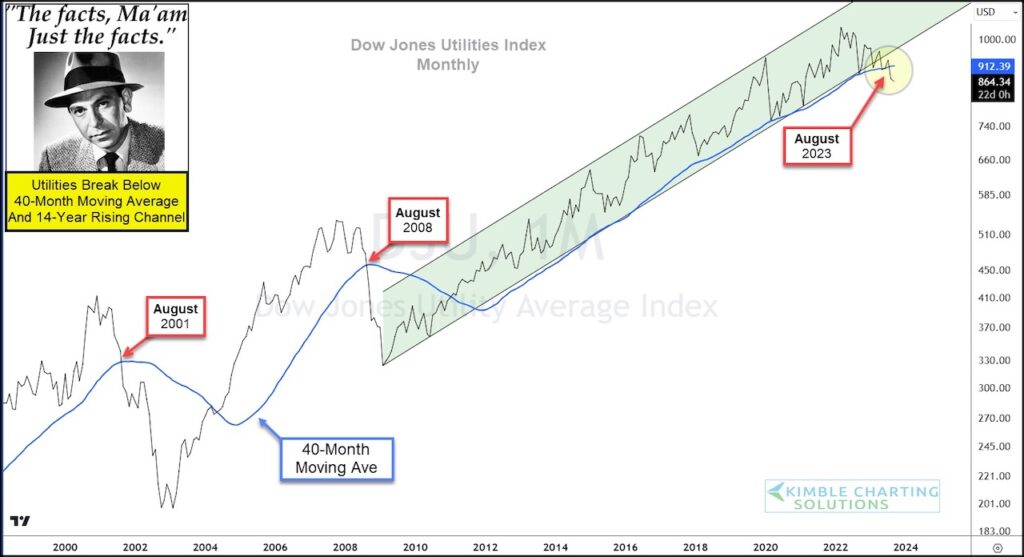
Today’s chart features a “monthly” view of the Dow Jones Utilities Index.
And, as you can see, the chart is very straight forward and telling.
For the first time in 15 years, the Dow Jones Utilities Index $DJU has broken below its 40-month moving average.
The past two times it did this were also in August. And both lead to considerable losses. More pain ahead for stocks? Stay tuned!!
Dow Jones Utilities Index “monthly” Chart
Note that KimbleCharting is offering a 2 week Free trial to See It Market readers. Just send me an email to services@kimblechartingsolutions.com for details to get set up.
Twitter: @KimbleCharting
Any opinions expressed herein are solely those of the author, and do not in any way represent the views or opinions of any other person or entity.
: Cup (and Maybe Handle) Watch")
 Trading Near Top Of Price Range")
 Reaches Important Price Support")