The market loves a good nautical analogy. And right now, no term sums it up better than “chop.” Defined as “small, steep disorderly waves at rapid intervals”, equity indexes continue to seek direction after the August pullback. One day we’re soaring on the news of a possible rate hike, the next day we’re selling off 1.5% on the news of a possible rate hike.
If the waves seem a bit too steep and disorderly to you and you’re looking for a signal that the market direction may be resolving, monitoring the market trends with the average true range (ATR) can help.
You can read more about the ATR indicator on StockCharts.
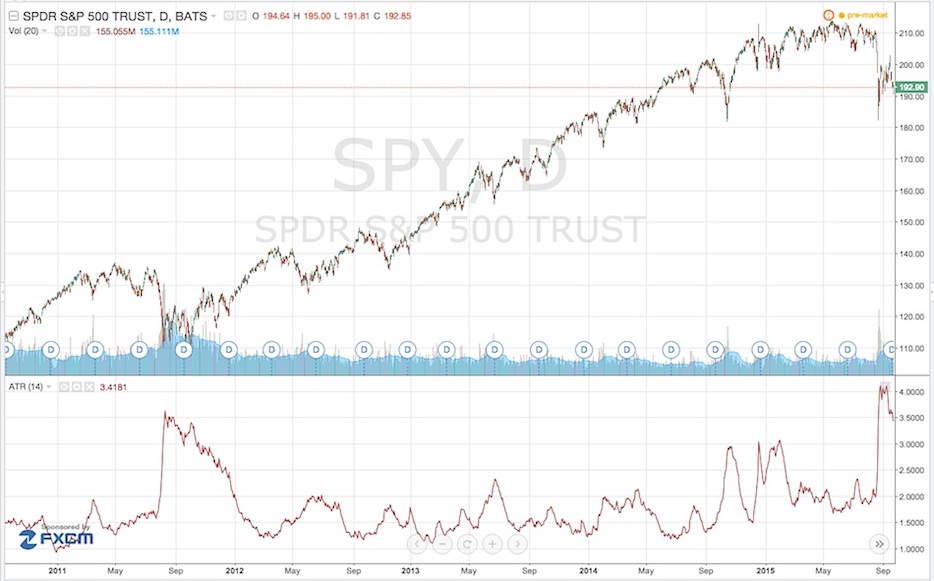
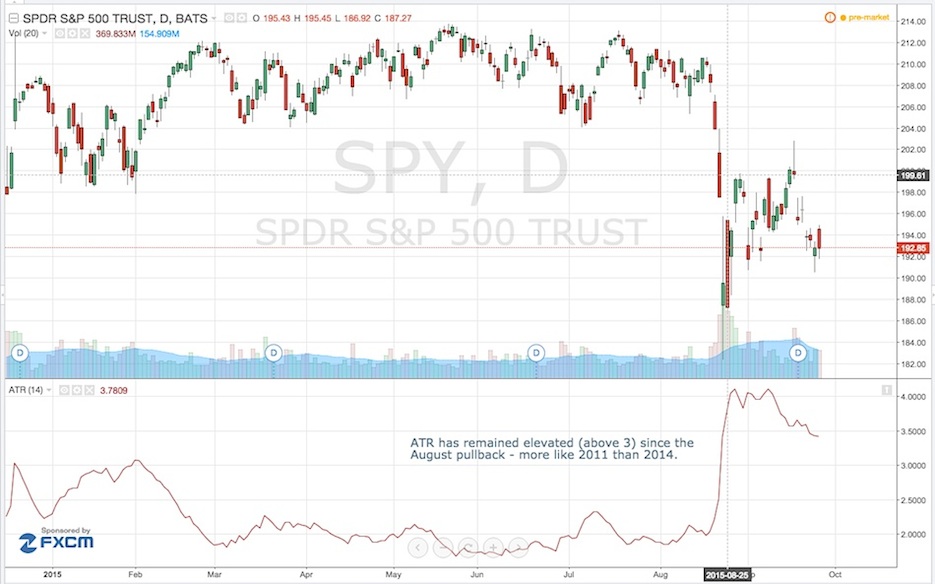
When the market sold off in August, the ATR spiked, doubling from a YTD average of 2. Although it has pulled back slightly to the 3.5 level, we can see from the longer-term view that this is still a historically high level from what we have witnessed over the past 4-5 years.
Notice how it resembles the 2011 pullback in stocks more than any other. That isn’t to say this is 2011 again, but just an indication that this is a more prolonged market correction like 2011.
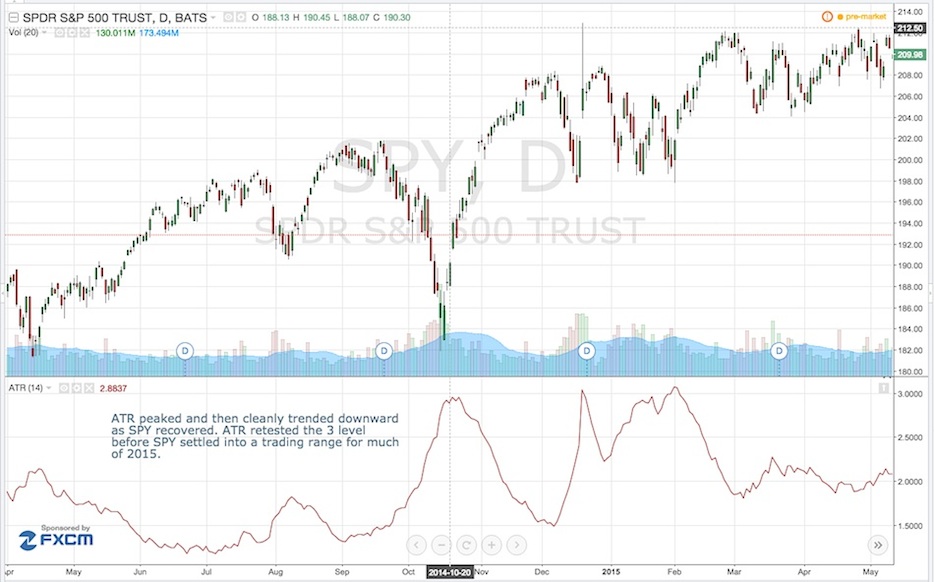
Many market participants initially called for an October 2014-style V-shaped rebound. But as you can see from the 2014 chart, the ATR trended down as cleanly as the SPY rebounded. Although the 3 ATR level was retested later in 2014 and early 2015, the broader trend was down for the ATR and up for the SPY (or at least not down further).
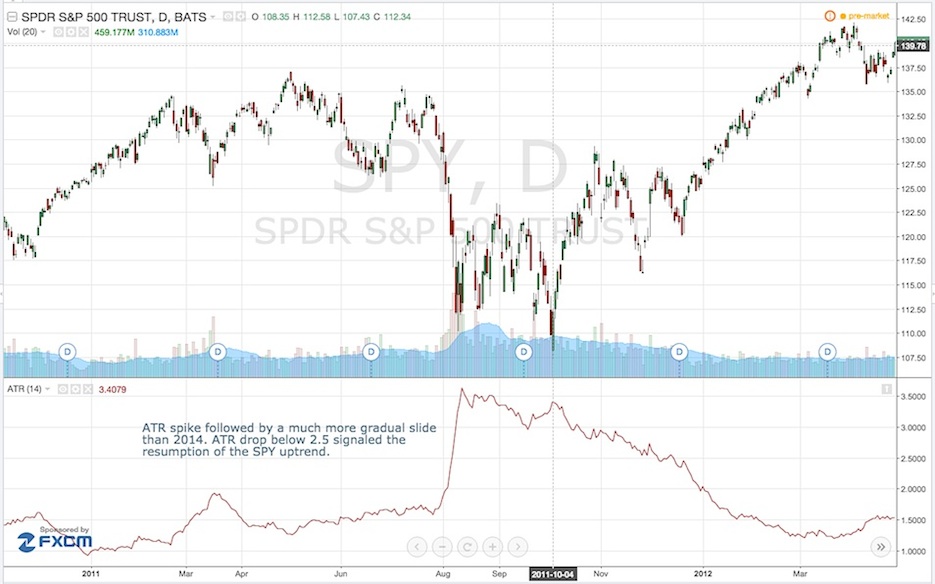
The more analogous market condition is likely the 2011 pullback. We saw a spike in ATR, followed by an elevated period until mid-October, at which point the SPY resumed its upward climb and the ATR declined in an orderly fashion.
While it’s still too early to tell which way equity markets will ultimately move, keeping a close eye on the behavior of the average true range may give you a clue and provide you with s better way to monitor the chop you are feeling on a daily basis.
Thanks for reading and good luck out there!
Any opinions expressed herein are solely those of the author, and do not in any way represent the views or opinions of any other person or entity.


 Testing Important Price Support")
")
