The USDJPY currency pair has been a great momentum play for currency traders over the past 2 years, as it has risen from the mid 70’s to around 120 in under 3 years time. A combination of additional easing by the Japanese central bank and the end of QE have provided a boost to the rally. But, rallies don’t move in straight lines forever.
So what’s the USDJPY chart telling us now?
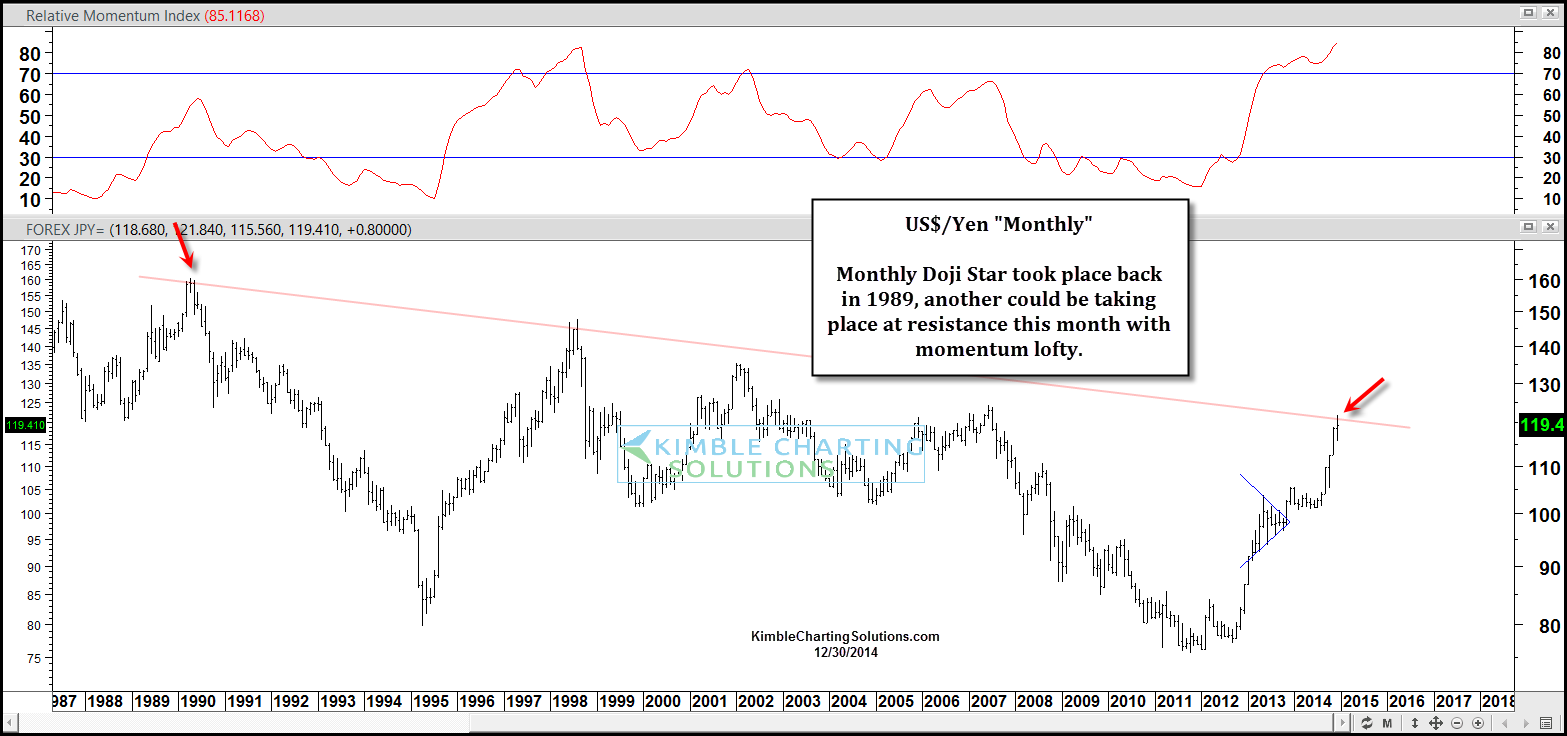
Well if we step back and look at a longer-term chart, it certainly seems to be “running” into resistance. A stronger US Dollar has added fuel to the rally in the second half of 2014. BUT, it has also pushed the currency pair into overbought territory. And, equally important, the USDJPY is putting in a bearish doji star reversal candle this month (right at key long-term resistance).
Will this combo bring about a pause to the rally, or perhaps spur a correction? That would mean either a period of US Dollar weakness or Japanese Yen strength (or both)?
Well it’s definitely something for investors to think about, as this bearish pattern aligns in time and price with a similar bearish doji star reversal pattern on the Nikkei 225 (you can read that post here).
USDJPY Long-Term Chart
The financial markets are interconnected in so many ways. And how this currency pair shakes out in early 2015 may effect portfolio construction going forward. Thanks for reading.
Follow Chris on Twitter: @KimbleCharting
No position in any of the mentioned securities at the time of publication. Any opinions expressed herein are solely those of the author, and do not in any way represent the views or opinions of any other person or entity.

: Worrisome to Broader Market?")
