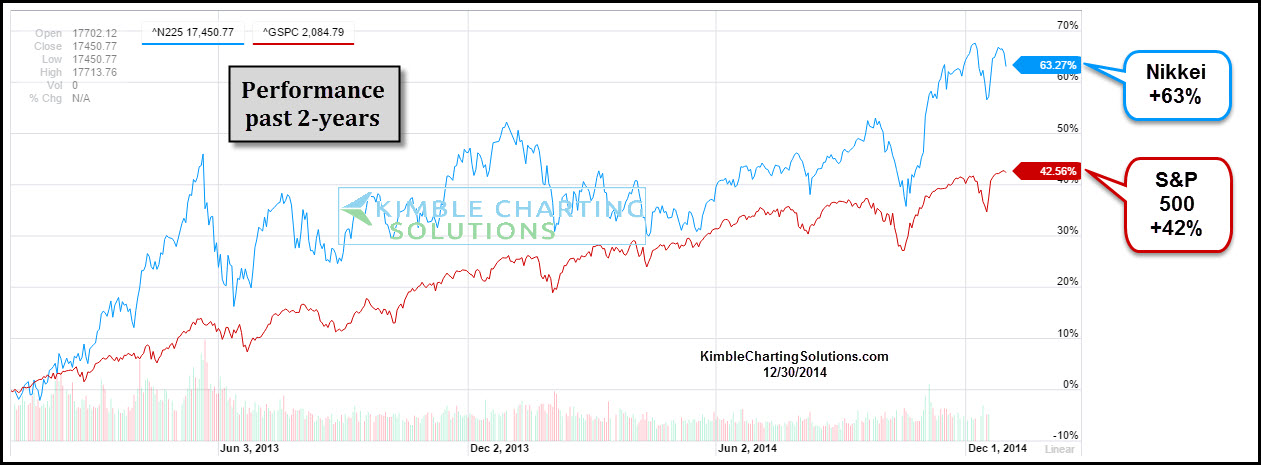
The past 2 years have been red-hot for Japanese equities. The best gauge of the Japanese stock market is the Nikkei 225 Index. And believe it or not, it is out performing the S&P 500 over the past 2 years… by a lot!
The performance chart below shows just how intense the rally has been for the Nikkei 225.
Nikkei 225 vs S&P 500 – 2 Year Performance Chart
BUT, there is also reason for caution. Looking at the monthly chart below, a “doji star” reversal pattern may be forming (for the month of December). And it’s forming right at the intersection of long-term lateral and down trend resistance lines – marked in yellow as point (1) in the chart below.
A follow through move lower would confirm this bearish reversal pattern, while a breakout above this 3-pronged resistance would be bullish.
Nikkei 225 Monthly Chart
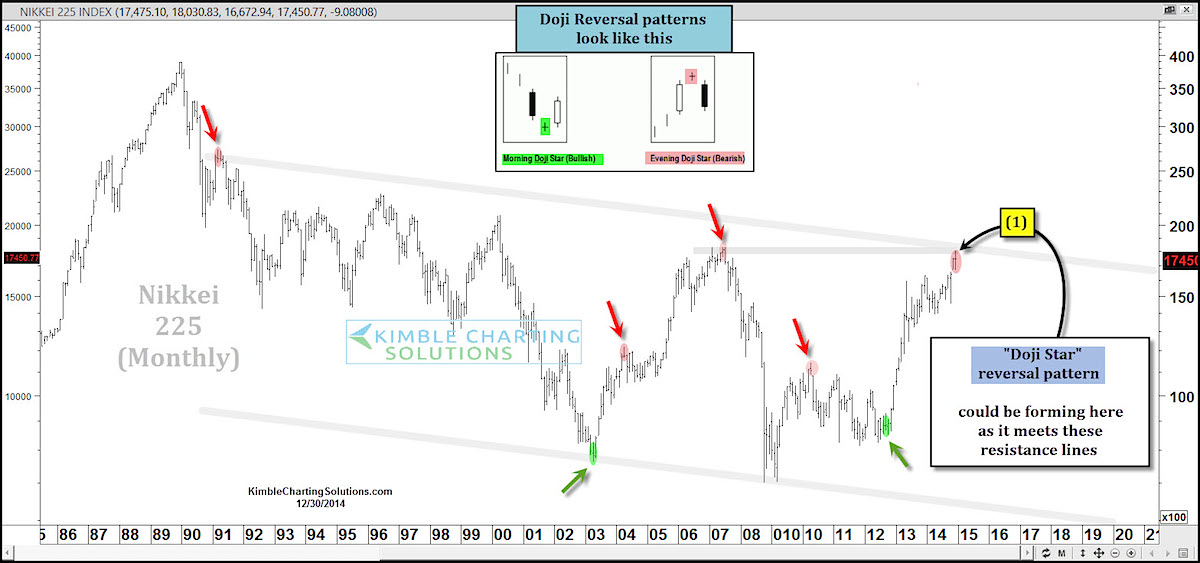
Either way, this resistance zone will be critical in determining the next major move for Japanese equities. And if this doji star pattern has anything to do with it, perhaps the hottest stock market on earth is set for a cool down. Thanks for reading!
Follow Chris on Twitter: @KimbleCharting
No position in any of the mentioned securities at the time of publication. Any opinions expressed herein are solely those of the author, and do not in any way represent the views or opinions of any other person or entity.


