The following chart and data highlight non-commercial commodity futures trading positions as of April 17, 2017.
This data was released with the April 20 COT Report (Commitment of Traders). Note that these charts also appeared on my blog.
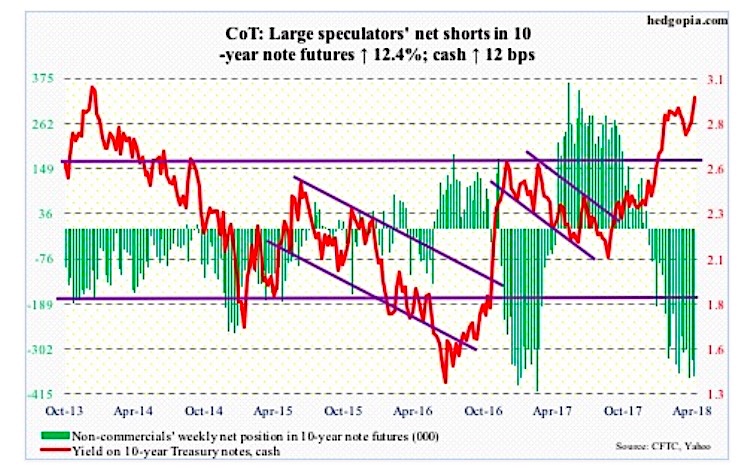
The chart below looks at non-commercial futures trading positions for the 10 Year Treasury Note plotted against the 10 year yield. For the week, the 10 year yield rose to 2.95%.
10 Year Treasury Note Futures (vs Yield)
10-year Note: Currently net short 371.7k, up 41.1k.
The Treasury yield curve once again is the talk of the town.
The yield spread between 10- and two-year notes fell to 41 basis points Tuesday. This was the lowest since October 2007. It closed the week at 50 basis points.
Two-year yields (2.46 percent) – seen as a proxy for monetary policy expectations – continue to rise, even as the 10-year rate (2.95 percent) remains bound by resistance at three percent.
As early as February 9, the spread was 78 basis points. At this rate, inversion is not far away. An inverted yield curve historically has preceded many of the US recessions.
Back in 2000, the yield curve went negative in February 2000, reaching minus 52 basis points in April that year. Recession began in March 2001.
Then in December 2005, the curve again went negative, reaching minus 16 basis points in February 2006. After briefly turning positive, it once again turned negative in June that year. By November, the spread was minus 19 basis points. Great Recession began in December 2007.
Markets’ preoccupation with inversion is understandable. With that said, a couple of points are worth noting.
First, post-financial crisis, both the short and long end of the curve remains manipulated. The economy is nearly nine years into recovery, and the fed funds rate is still sub-two percent – was raised by 25 basis points last month to a range of 150 to 175 basis points. On the long end, the Fed’s SOMA holdings include $2.28 trillion in Treasury notes and bonds, up from just north of $400 billion pre-crisis. This put downward pressure on long yields.
Second, because of this very fact, the historical relationship between inversion and recession may or may not work this time around. Do we absolutely have to have the former for the latter to occur? No one knows. The post-Great Recession recovery has broken many an established record.
Twitter: @hedgopia
Author may hold a position in mentioned securities at the time of publication. Any opinions expressed herein are solely those of the author, and do not in any way represent the views or opinions of any other person or entity.


