As the S&P 500 has been declining in dramatic fashion this week. During this duress, 10 year treasury notes (ZN) have stabilized. A “flight to safety” trade is common when equities decline.
That said 10 year treasury notes are in the declining phase of their current intermediate market cycle.
This cycle is depicted in the weekly chart below by the blue semicircles at the bottom of the chart.
/ZN Treasury Notes Chart (Weekly Bars)
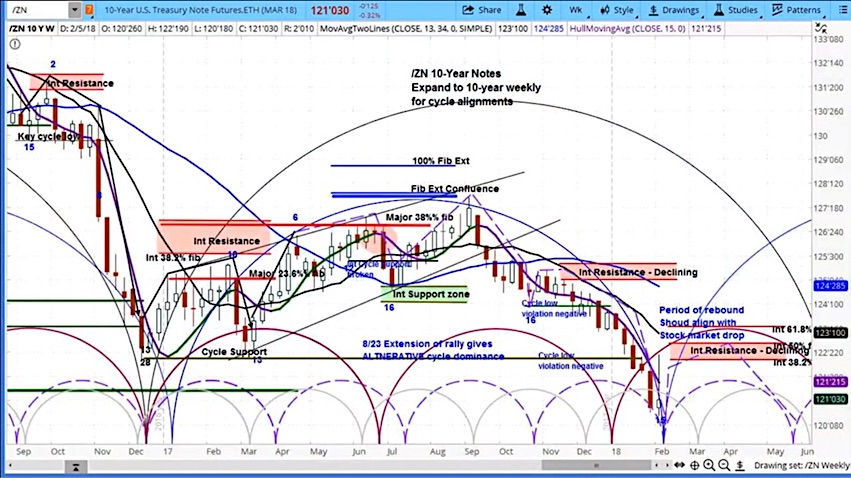
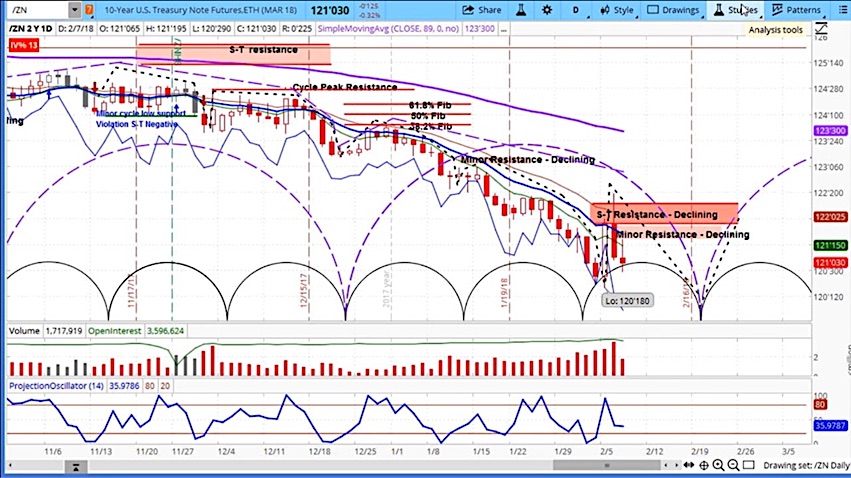
The completion of a market cycle normally coincides with an important low. However, that may be slightly delayed, as seen on the daily chart below. As shown, the notes still have several trading sessions left before they reach the end of the corresponding market cycle.
As the move lower in equities still appears to be in play, we may see another flight to safety, or at least the prevention of a significant move lower in the notes as they complete their current market cycle.
The bottom line is this. As the market cycle on the daily chart draws to a completion, the likelihood of a bounce in treasuries, that may last for several weeks, increases.
/ZN Treasury Bonds Chart (Daily Bars)
For more detail on our analysis, including the 30-year bonds, check out our latest video, which is a clip from our weekly series “FutureSpeak”:
Visit our site for more on our approach to using market cycles to analyze stocks.
Twitter: @askslim
Any opinions expressed herein are solely those of the author, and do not in any way represent the views or opinions of any other person or entity.


