The past several months have been difficult for long-dated US treasury bonds.
Today, we use the $TLT (20+ Year US Treasury Bond ETF) as a proxy. It is currently testing last year’s low.
So why is this so important? Well, first of all, whether you like technical patterns or not there is a massive head and shoulders formation that has formed over 3 years. Last years low is the neckline.
But more importantly, it represents a key theme of the past year: inflation. Interest rates aren’t rising because the world economy is running perfectly. A strong break to the downside would warn of higher interest rates and a bond market in trouble. The trouble stems from the amount of money invested or tied to treasury bonds. Bond prices go DOWN when yields (interest rates) go up.
So today we just look at a simple long-term chart…
Note that the following MarketSmith charts are built with Investors Business Daily’s product suite.
I am an Investors Business Daily (IBD) partner and promote the use of their products. The entire platform offers a good mix of analysts, education, and technical and fundamental data.
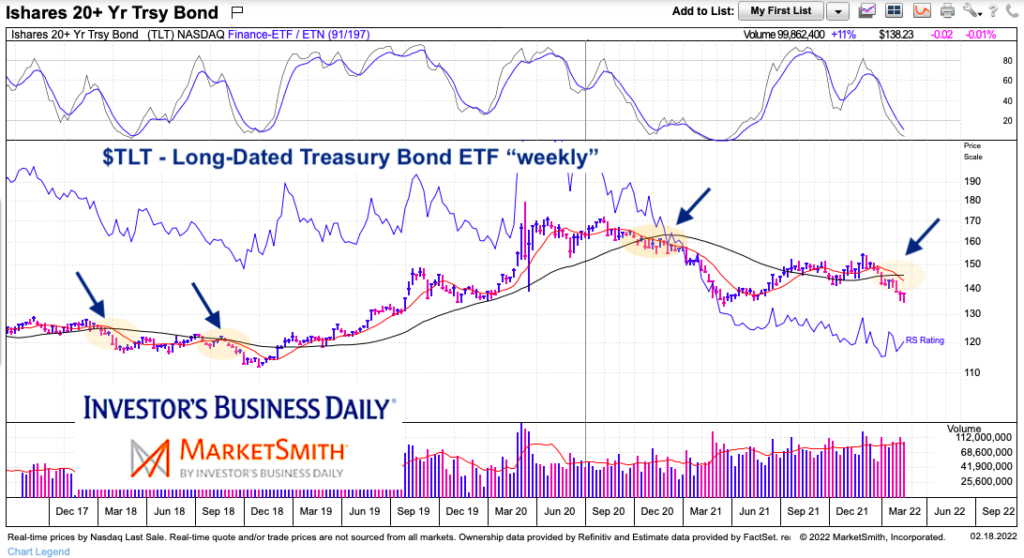
$TLT 20+ Year US Treasury Bonds ETF “weekly” Chart
Much of this chart has been discussed above. However, there is another nuance that is of interest here. The 10- and 40-week moving averages are crossing over (bearish). This has occurred 3 times in the past 5 years. The last one lead to a steep decline. But the two before that lead to more of a slow bleed before firming up. Either way, the chart is in rough shape.
Twitter: @andrewnyquist
The author has a trading position in mentioned securities or similar at the time of publication. Any opinions expressed herein are solely those of the author, and do not in any way represent the views or opinions of any other person or entity.

: Showing Some Signs of Emerging Strength")
