The stock market rose and fell last week, mainly based on U.S. and China trade headlines.
Trade negotiations have taken a step backward with the raising of U.S. tariffs to 25% on $200 billion of annual Chinese imports, retaliation by China, and the Administration contemplating tariffs on the remaining $300 billion in Chinese imports.
Stocks are also having to contend with mixed data on the health of the U.S. economy.
Industrial production, retail sales and existing home sales were all less than expected. This is offset by record low unemployment rates. So where do we go from here?
We still believe that a trade deal will be reached, although it may take many months. We must not lose sight that the Chinese government has a very definite sense of its own national destiny with a goal of surpassing the U.S. economically, technologically and eventually militarily. They are busy creating their own international economic system, the Belt and Road infrastructure project, as opposed to adapting to a Western-led financial and trade system.
The United States is clearly standing in their way. However, both sides have too much at stake not to reach some form of an agreement as a trade war could throw China into a deep recession and the president needs a strong economy to keep enough support to win the 2020 election. For now, investors are cautiously optimistic but we are certain that volatility in the markets will continue as the trade battle wages on.
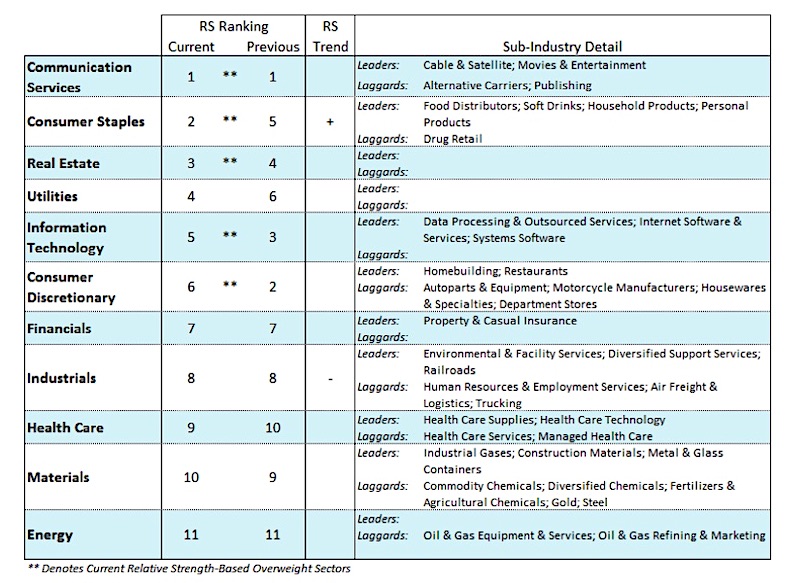
We think its wise for investors to stay with the strongest S&P 500 sectors which include the defensive sectors of Utilities (XLU), Consumer Staples (XLP) and REITs along with communication services and consumer discretionary. Short-term Treasury notes may offer a safe haven as well.
Stock market breadth continues to be problematic. This is seen by the fact that with the S&P 500 Index within 4.00% of record highs, less than 50% of the 100 industry groups within the S&P are in defined uptrends. This is in contrast to the 2017 example with the S&P at new highs more than 85% of the industry groups were in uptrends.
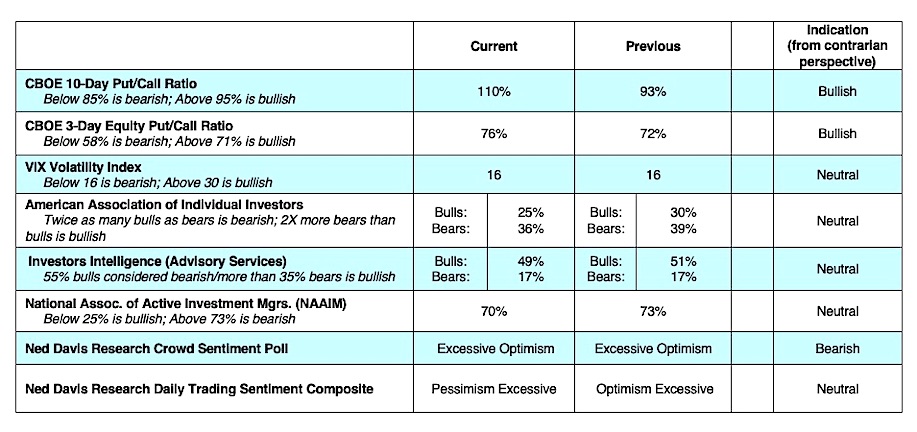
Weakness in market breadth is also seen in broader based indices including the Russell 2000, the NY Composite (more than 2000 stocks) and Value-line Geometric (1500 stocks) having underperformed and showing virtually no upside progress since February. Further evidence of narrow leadership can be seen by the fact the percentage of S&P 500 stocks trading above their 200-day moving average is below where it was four months ago. Investor sentiment indicators are mixed, suggesting a neutral posture.
Twitter: @WillieDelwiche
Any opinions expressed herein are solely those of the author, and do not in any way represent the views or opinions of any other person or entity.

 Flirting With Critical Support… Again")


