The U.S. equity markets continue to grind higher encouraged by recent economic data, including strong retail sales, a vibrant labor market and a high level of consumer confidence.
Improving economic conditions are being reflected in the bond market with the yield curve steepening in recent weeks.
The yield on the benchmark 10-year Treasury note has rallied to 2.56% from 2.35% in March. Further evidence that the economy is moving away from recession is expected to be seen in the initial reading of first-quarter GDP to be released on Friday. The Atlanta Fed has raised its first-quarter growth estimate for the economy to 2.8%, up from less than 1.0% in February.
Despite the improving underlying strength of the U.S. economy, inflation remains contained which should allow Fed Chief Jerome Powell to maintain a level course on interest rates.
First-quarter earnings season is officially underway with only 15% of S&P 500 companies reporting. The results have been mixed. Considering the bar has been set very low for first-quarter profits, the likelihood is that any surprises could be on the upside. According to Ned Davis Research, three sectors (Real Estate, Materials and Energy) are expected to post modest earnings declines with all others expected to report positive numbers.
Consensus estimates call for earnings growth to be flat for the second quarter with most of the profit gains coming in the latter half of 2019. Historically, stocks have done best when earnings gains have been modest as opposed to when earnings growth has been strong. In a slow growth earnings environment, growth stocks typically outperform value stocks.
We recommend focusing on the strongest S&P 500 sectors which include technology, consumer discretionary, communications services and consumer staples.
The S&P 500 Index and the Dow Industrials have moved to within close proximity of the record September highs. However, the technical underpinnings of the market have deteriorated in recent weeks raising the prospects for a near-term pullback/correction. Stock market breadth, that showed signs of improvement early in the first quarter, has failed to keep pace with recent price gains as seen by the fact that fewer stocks are participating in the current rally.
Over the past 30 days, the percentage of stocks trading above their 50-day moving averages has declined from 80% in March to 70%. The number of issues hitting new 52-week highs has fallen while the number of issues hitting new 52-week lows are expanding. Despite the rally in the S&P 500 Index, only 59% of the 100 industry groups within the index are in defined uptrends, down from 80% in January 2018. The fact that the Russell 2000 Small-Cap Index has failed to keep pace with large-cap indices is another signal that market breadth has weakened.
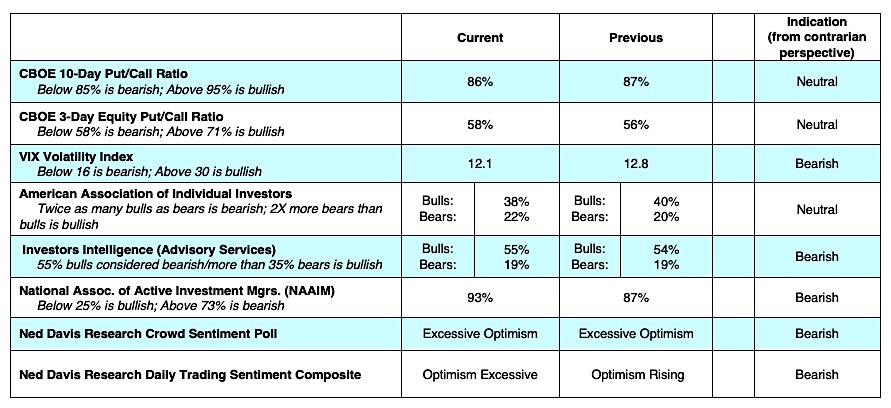
Measures of investor sentiment that showed pessimism at an extreme in January have moved nearly 180 degrees with optimism climbing toward levels considered excessive. This can be seen in the significant decline in the demand for put options (investors buy puts in anticipation of a market decline) and the plunge in the CBOE Volatility Index (VIX) to levels last seen at the stock market peak in the third-quarter of 2018. The VIX is considered as a measure of fear in the market and is widely used as a contrary indicator.
The bottom line is that the economic fundamentals are favorable and suggest a continuation of the long-term bullish trend, but the stock market’s technical position raises the potential for near-term weakness.
Twitter: @WillieDelwiche
Any opinions expressed herein are solely those of the author, and do not in any way represent the views or opinions of any other person or entity.


