The world economy has been weighed down by heavyweights Europe and China in 2015. And that’s not to say the US economy has been stellar either. In fact, the US economy is still uncertain enough that the Federal Reserve has put of an interest rate hike during recent meetings (even though the Fed hinted it was ready to hike rates).
Perhaps the rest of the world has played a role in delaying the Fed.
Either way, this backdrop has likely slowed the rise of the US Dollar Index. In fact, if you look at timing, the dollar peaked just before the slowdown. Now everyone is watching to see if the Fed (and the rest of the world) have as much control over the currency markets as once thought.
The Forex is the largest market in the world. And the US Dollar is the deepest and most important currency in the world. As the reserve currency, a lot of world debt is issued in US Dollars (see the emerging markets).
And this is why investors should be concerned about the long-term formation of the US Dollar chart.
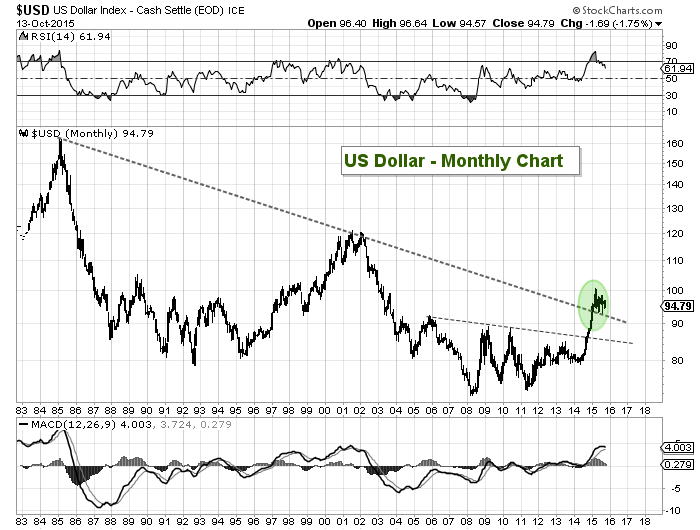
Let’s look at a long-term chart first, then share a couple intermediate-term views. As you can see below, the US Dollar Index looks like it has broken out of a downtrend and is now in a new bull market.
US Dollar Long Term Chart – Bullish Breakout?
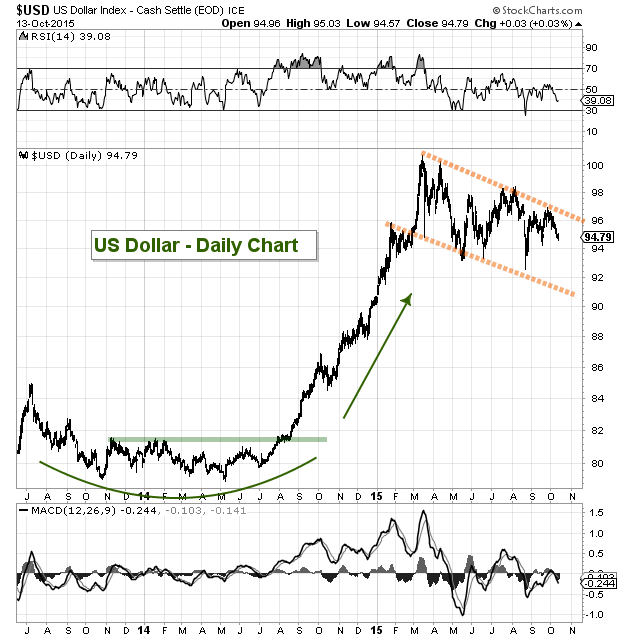
The next chart looks at the past 2 years and shows the thrust higher in 2014 and bullish flag formation that has formed in 2015 (during a corrective/consolidation phase). Clearly the buck was overbought and is still working through a pullback (that is in progress).
Although the Dollar looks to be weighted down near-term, this is still constructive consolidation.
US Dollar Index – Bullish Flag Formation?
Lastly, let’s look at some key Fibonacci support levels to watch during this pullback. The .382 Fibonacci retracement was hit in August. We’ll have to see if this level holds. If now, 89-92 may very well be the final resting point before another move higher begins. However, any sustained move below 89 will put thoughts about a new bull market in question.
With the growing amount of debt in the world, investors should watch the US Dollar here. We could be in for interesting times over the coming decade. Stay tuned.
continue reading for more charts and analysis on the US Dollar…


