After a multi-month run higher into early 2015, The US Dollar Index has transitioned into consolidation mode. What happens next bears importance, especially in a world of low rates, currency wars, and deflationary concerns.
This post isn’t to be construed as a “trading” post or some sort of unique Forex insight. This is more of a macro post about one of the more important intermarket variables to the financial market.
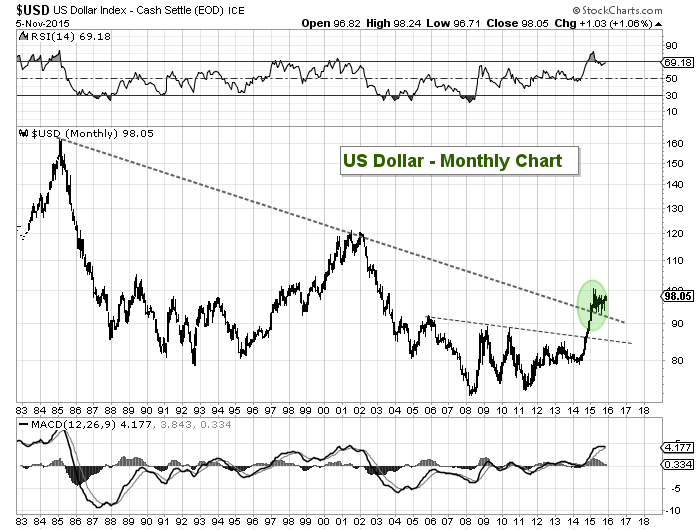
As you can see in the chart below, the US Dollar was basically cut in half from 1985 to 2008. The real estate collapse and subsequent global economic crisis brought about what may end up being a final wave lower for the world’s reserve currency, as the Federal Reserve attempted to halt the economic slide with stimulus, qe, more qe, and more qe (just about everything under the sun).
But the dynamic shifted over the past two years as the US brought its programs to a halt and other developed areas fought deflation with renewed vigor – i.e. Europe and Japan. As a result, the Japanese Yen and the Euro have turned lower as their central banks continue to push stimulus programs, bond buying, and zero rates. All this while the Federal Reserve looks (i.e. hopes/prays) to tighten and “normalize” policy.
That said, the current economic conditions in the world are anything but normal. And the price action on the US Dollar Index over the past 5 plus years highlights this shifting dynamic. Until there is another currency (or basket) that can supplant the US Dollar, the buck is the only game in town.
Lastly, this isn’t a post to predict anything other than to show the importance of what’s happened and how close the US Dollar Index is to a major long-term breakout and shift in cycle.
The chart below is a 30 year chart, so think of it in that time frame. Note that the Relative Strength Index (RSI) is still elevated. There is still a good chance that the correction isn’t over and the US Dollar Index pulls back further (see second chart below for more detail). Lastly, as long as the monthly RSI stays above 50, though, the bulls are in charge.
US Dollar Index – 30 Year Chart
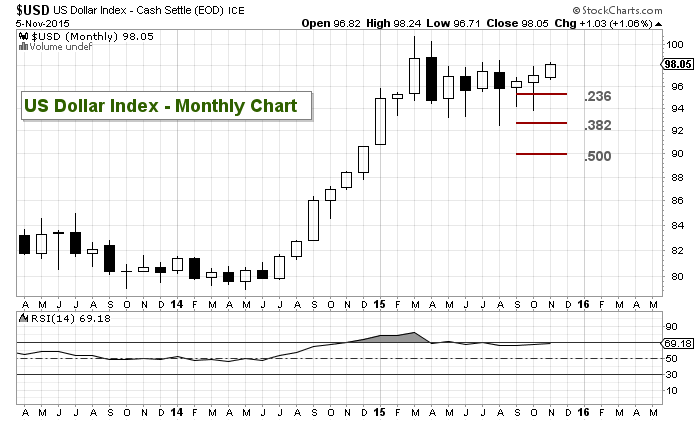
The next chart is a look at last 2 years with some key Fibonacci retracement levels.Note that the US Dollar Index touched the .382 Fibonacci retracement of it’s big rally higher. This doesn’t mean that the “correction” is over, but is does show that it is still within the confines of a bullish consolidation pattern. With the MACD turning lower and RSI around/under 70, I wouldn’t rule out another pullback and/or more consolidation.
US Dollar Index – Key Fibonacci Support Levels
Thanks for reading.
Twitter: @andrewnyquist
No position in any of the mentioned securities. Any opinions expressed herein are solely those of the author, and do not in any way represent the views or opinions of any other person or entity.

: Showing Some Signs of Emerging Strength")
