With BRICS happening ahead of Jackson Hole, we thought it would be good to look at the technical charts on both the dollar and the long bonds.
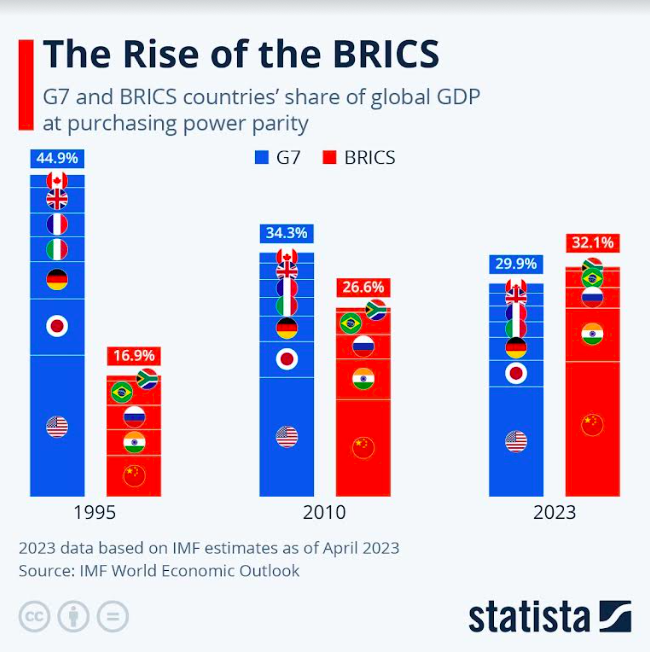
The chart below shows that BRICS versus G7 as a share of purchasing power has increased since 1995.
With the number of countries looking to price goods in some other currency besides the US dollar, the dollar is holding up rather well.
And, with “higher for longer” most likely the narrative out of Jackson Hole, the long bonds caught a bid.
The lesson this entire year has been to follow price and the technical guidance the charts provide.
With that in mind, we look at 3 indicators on both charts.
- Price patterns
- Momentum patterns
- July 6-month calendar range patterns.
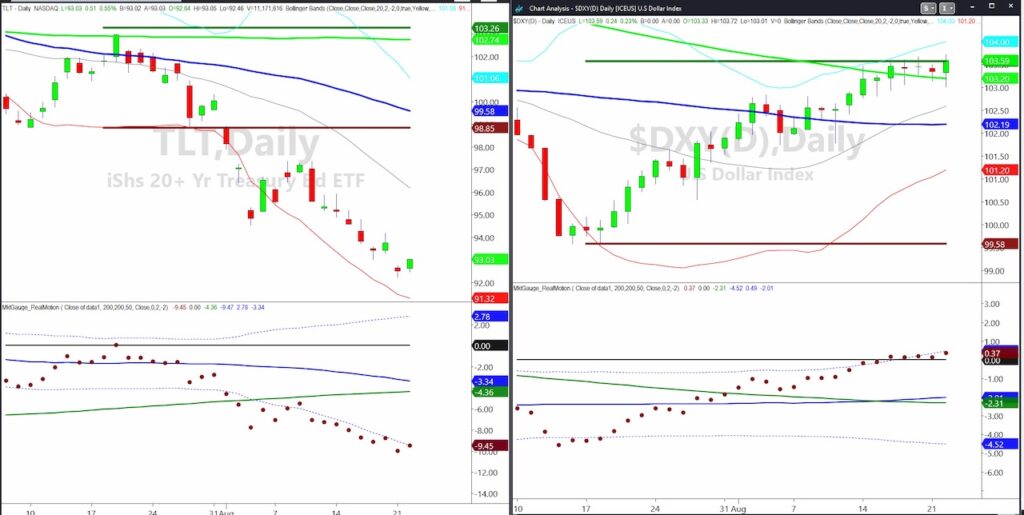
The long bonds TLT could have made a genuine reversal off the lows as our Real Motion indicator had a bona fide mean reversion signal.
The price also indicates a glass bottom pattern with a reversal off a new low, followed by a strong up day on below average volume.
TLT is so well below the July 6-month calendar range low that one has to wonder not only can it get back to 98.85, but what are the implications if does so?
The dollar, as far as price, has a lot of resistance between 103.50-103.70. In fact, that resistance lines up perfectly with the July 6-month calendar range high.
Above that level one would have to believe that the dollar will get even stronger.
Nonetheless, as we have seen with the calendar ranges in the indices, since none cleared the July 6-month CRH, the sell-off was palpable.
Momentum shows resistance at the Bollinger Band that is also working off of a mean reversion sell signal from a few days ago.
However, the price is flat.
If you put both charts together, we see the potential for the dollar to drop from here while yields could soften and TLTs could rise.
If this occurs, it is not good for equities or risk.
But, perhaps, quite good for gold and silver.
Twitter: @marketminute
The author may have a position in mentioned securities at the time of publication. Any opinions expressed herein are solely those of the author and do not represent the views or opinions of any other person or entity.
8/23/23 at 9:37am (editor’s note): Updated missing text in list for “3 indicators”.

 Trading Near Top Of Price Range")


