JANUARY 2016 WASDE REPORT HIGHLIGHTS FOR CORN AND MARKET REACTION
The January WASDE report provided some much needed support to the corn market, and although it didn’t necessarily translate into a sharply higher weekly close, it did suggest signs of a floor possibly being established. What were the supportive elements in the January Crop report?
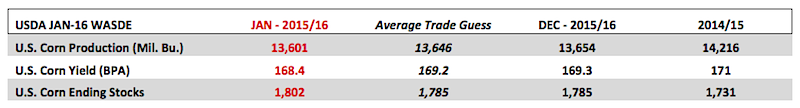
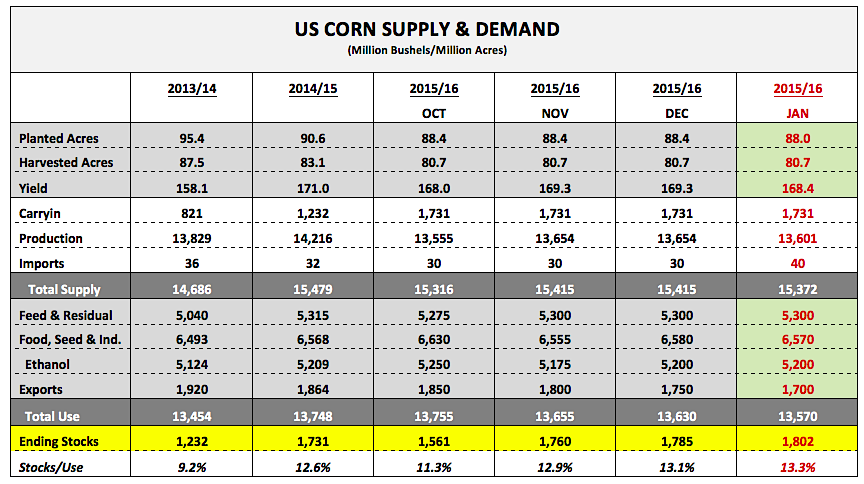
- The 2015/16 U.S. corn yield was lowered to 168.4 bushels per acre, which still represented the 2nd best corn yield in history; however it was lower than the USDA’s November forecast and also 0.8 bpa BELOW the average trade guess of 169.2. The result was total U.S. corn production falling to 13,601 million bushels, down 53 million from November and 45 million bushels LESS THAN the average trade guess of 13,646 million.
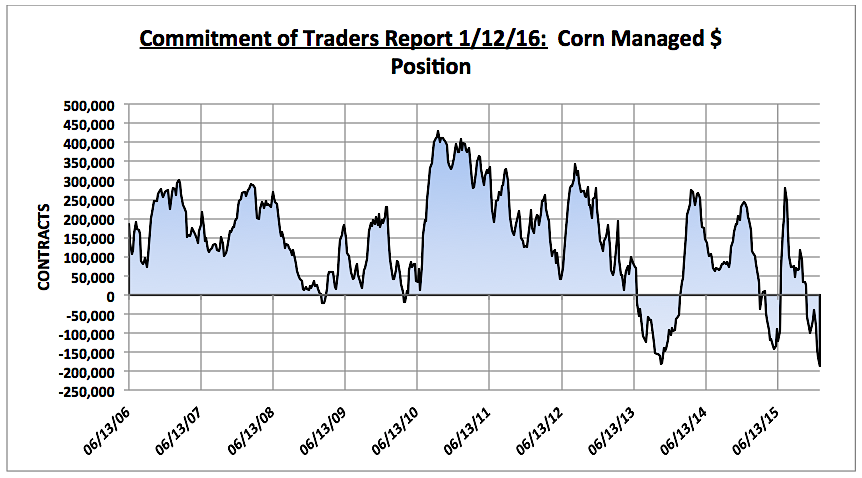
How bullish is this negative U.S. supply revision for the corn market? The report came out Tuesday mid-morning and March corn futures responded by closing up 5-cents per bushel that afternoon. I think the nickel higher close was a fairly good representation of the USDA’s revised January projections. Because the yield and production figures were below the average trade guesses the market almost had to respond positively despite the downward adjustments being largely inconsequential. It also didn’t hurt that the Managed Money position in corn had ballooned to a near record net short of -161,988 contracts as of the market close on January 5th. Therefore the $ was slanted heavily negative pre-report, with the majority anticipating corn yields and corn production increases. That said I would assume at least a small percentage of those shorts covered after corn futures held following the January WASDE report release. This invariably provided a momentary lift to corn futures. However, the other major factor limiting the upward price response was the increase to 2015/16 ending U.S. corn stocks (despite the production decrease), which improved to 1,802 million bushels, up 17 million month-on-month. The USDA trimmed U.S. corn exports another 50 million bushels to 1,700 million, which almost entirely neutralized the corn yield/corn production decline. Since the May Crop report the 2015/16 U.S. corn export projection has now been cut 200 million bushels.
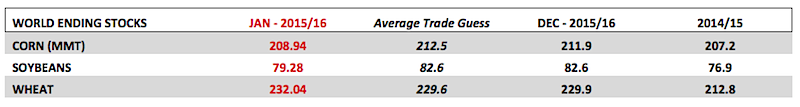
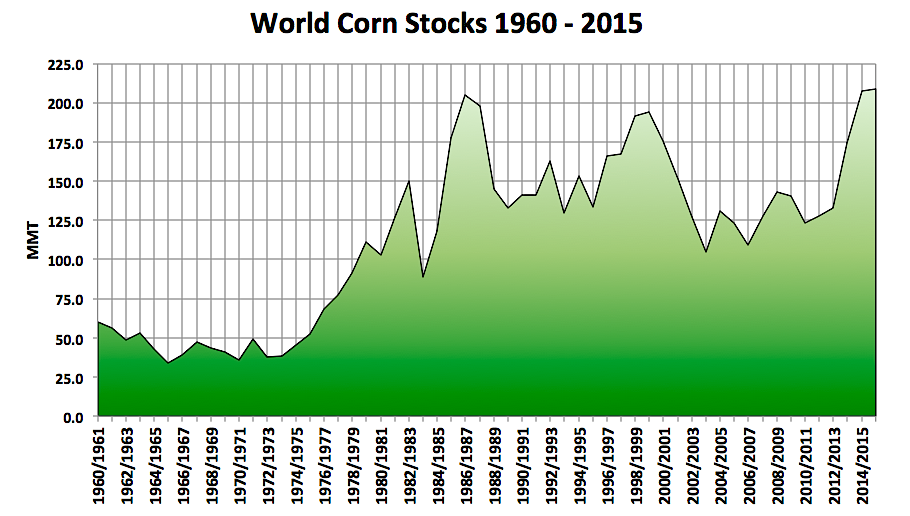
- The other “mildly” supportive surprise in the January WASDE report was an unexpected 2.88 MMT decrease to 2015/16 World corn stocks, which fell to 208.9 MMT. This forecast was also down 3.6 MMT from the average trade guess of 212.5 MMT. The lower carryout projection was attributed primarily to a reduction in carryin stocks, as well as, a 4 MMT cut to South Africa’s corn production estimate, which was lowered to 8 MMT. South Africa is experiencing its worst harvest since 2006/07 (7.3 MMT) due to an extensive drought.
How bullish is this negative World corn stocks revision for the corn market? It should have virtually no impact on corn futures prices. World corn stocks remain at record high levels. In fact only 3 times in history have World corn stocks exceeded 200 MMT (1986/87, 2014/15, and 2015/16). South Africa’s drought reduced crop is expected to push imports up to a 24-year high of 1.5 MMT (largest since 1991/92; equals 59 million bushels total); however that’s not enough to have much, if any lasting market influence unless that total rises significantly. Brazil, Argentina, and Ukraine’s 2015/16 corn production estimates were all left nearly unchanged at 81.5, 25.6, and 23.5 MMT respectively. Those three countries represent the largest, non-U.S. world corn exporters, collectively accounting for approximately 49% of total world corn exports.
Other Notables from the January WASDE Report:
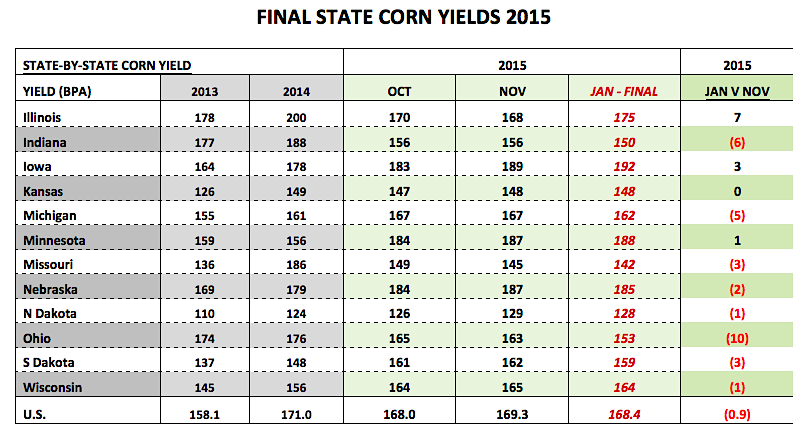
- Record Corn Yields Achieved in Several Key Western Corn Belt States in 2015: Record state corn yields were scored in Iowa, Minnesota, Nebraska, South Dakota, and Wisconsin. Iowa’s corn yield was finalized at 192 bushels per acre, exceeding its previous high of 182 bpa in 2009. Nebraska’s yield reached 188 bpa versus its prior record of 179 bpa, established just one year ago in 2014. And Minnesota’s corn yield was 188 bpa, besting its all-time high of 177 bpa from 2010. Iowa, Nebraska, and Minnesota were the 1st, 3rd, and 4th largest state corn producers in 2015, collectively accounting for 41.4% of total U.S. corn production.
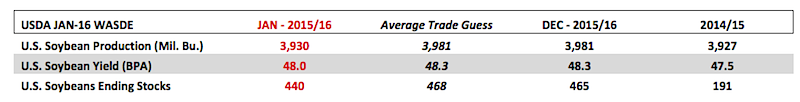
- Record U.S. Soybean Yield in 2015/16: In the January WASDE report the USDA lowered the U.S. soybean yield to 48.0 bushels per acre, which was 0.3 bpa below the November forecast; however that figure still represented a new record high. The previous record of 47.5 bpa was established in 2014/15. Therefore the U.S. has now produced record soybean crops in two consecutive growing seasons. It should also be noted that 2015/16 U.S. soybean ending stocks fell to 440 million bushels versus 450 million in December and the average trade guess of 468 million. Therefore due to both the U.S. soybean yield and soybean carryout falling BELOW pre-report average trade guesses January soybean futures (SF6) managed a 9 ¾-cents per bushel higher close Tuesday afternoon.
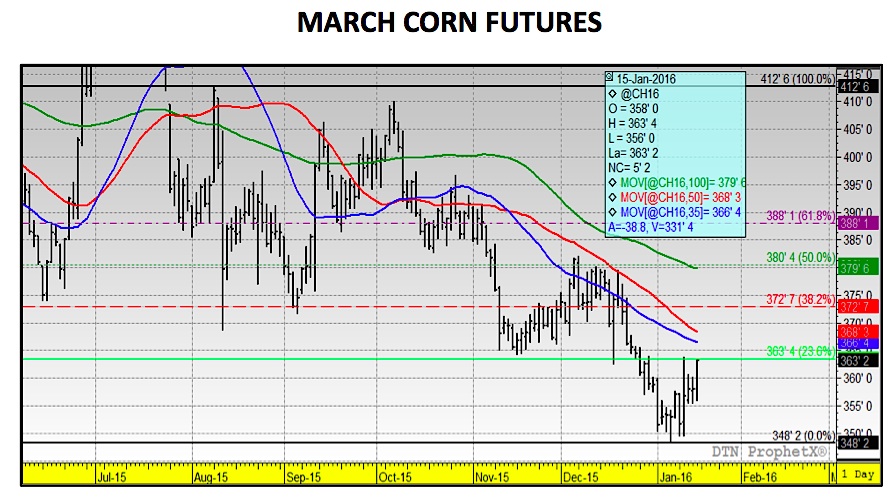
MARCH CORN FUTURES PRICE FORECAST (CH6) – March corn futures managed a 6 ¼-cent higher weekly close finishing at $3.63 ¼ on Friday afternoon. It was nice to see corn prices bounce despite the ongoing meltdown in the energy complex. Is this the start of an upward trend change in corn? I’m hesitant to get overly positive on corn futures considering both U.S. and World ending stocks remain burdensome, Crude Oil futures closed under $30 per barrel, and the Dollar Index continues to trade well over 98.0. That said, the latest Commitment of Traders report showed the Managed Money position in corn futures increasing to a new record net short of -186,831 as of the market close on January 12th (previous record was -180,627 contracts on 10/29/13). Therefore given the higher weekly corn futures close, as well as some technical indications suggesting the market is now “oversold,” I wouldn’t be surprised to see money managers start covering a higher percentage of their massive net short. This could provide the momentum necessary for corn futures to sustain Friday’s strong finish early next week. If March corn futures can negotiate a close over both the 35 and 50-day moving averages of $3.664 and $3.683 respectively, a move up to the 100-day moving average at $3.796, which also coincides with a key day high on 12/18, seems plausible. That would represent approximately a 17-cent rally, which isn’t necessarily a game changer but would still be welcomed based on recent price activity.
March Corn Futures Chart
Thanks for reading.
Twitter: @MarcusLudtke
Author hedges corn futures and may have a position at the time of publication. Any opinions expressed herein are solely those of the author, and do not in any way represent the views or opinions of any other person or entity.
Data References:
- USDA United States Department of Ag
- EIA Energy Information Association
- NASS National Agricultural Statistics Service


: Showing Some Signs of Emerging Strength")
