Corn prices continued to work lower this week, finishing down 12-cents per bushel week-on-week at $3.63 CZ5. December corn futures have yet to recover from the August WASDE report and the USDA’s unexpected 2 bpa national corn yield increase. On August 10th, December corn futures traded up to a day high of $4.02. Two days later, following the release of the August Crop report, values plunged to a new contract low of $3.57 ½. Since then CZ5 has attempted to stabilize, however any illusions of a quick recovery have been tabled with the market now seemingly quite content with this year’s supply side prospects.
 Monday’s Crop Progress report showed the US corn crop rated a very respectable 68% good-to-excellent versus 74% a year ago. Both Informa and FC Stone issued revised September corn yield estimates this week of 168.8 bpa and 165.9 bpa respectively versus the USDA’s August forecast of 168.8 bpa. It’s also worth noting that a year ago December corn futures traded down to a day low of $3.19 on October 1st, 2014. That said a material upward trend change in corn prices now appears unlikely over the next 30 days.
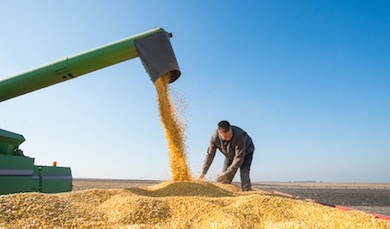
Over the last several months the focus in corn almost exclusively has been on 2015 US corn yield and production potential. However as the market transitions into the harvest time-frame, and with no immediate concern regarding a sharply lower yield estimate looming in the September Crop report, the next major obstacle to sustainable corn rallies appears to be limited demand growth. Over the next 3 weeks I’ll assess US corn demand prospects for each major sector including exports, corn-ethanol demand, and feed and residual use. This week I centered on corn exports.
US CORN EXPORTS:
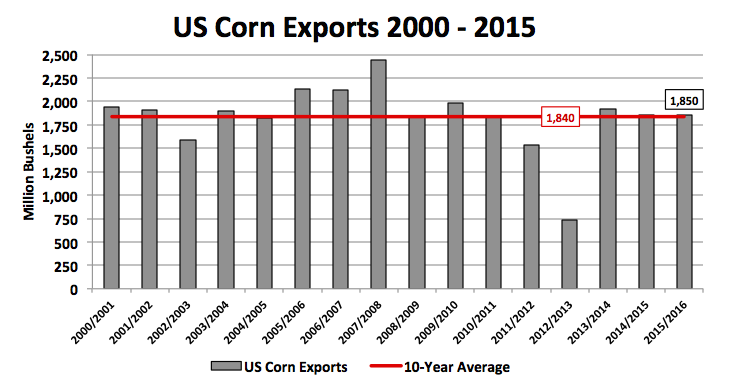
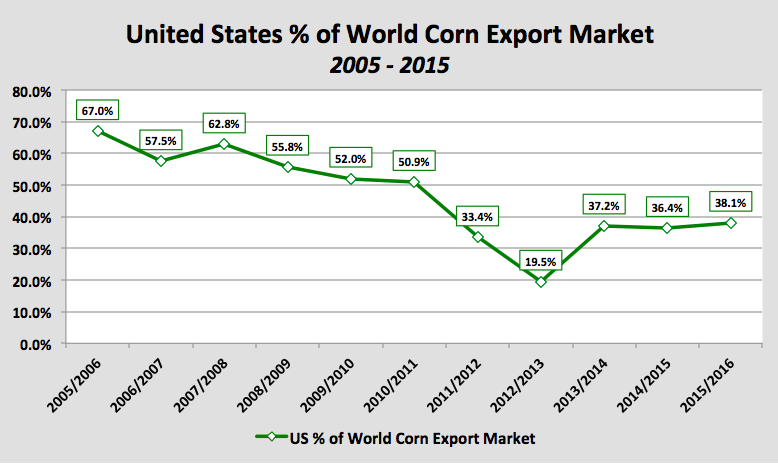
US corn exports for 2015/16 are currently projected at 1,850 million bushels, which is unchanged from a year ago, and just 10 million bushels higher than the 10-year average from 2005 through 2014. From 2000 through 2015, the marketing year high for US corn exports was 2,437 million bushels, which came in 2007/08. However since then US corn exports have failed to exceed even 2,000 million bushels for any one particular crop year. This discouraging demand trend for Corn Bulls has occurred despite continuous USDA Baseline S&D forecasts predicting otherwise. In fact this week I went back and looked at the USDA’s Agricultural Projections from 2010, which at the time included the USDA’s US corn export demand estimates through 2019/20. In that report the USDA had projected 2015/16 US corn exports of 2,325 million bushels versus today’s actual figure of 1,850 million. The reality is that over the last 5-years the US’s total market share of World corn exports has fallen to approximately 33% versus an average of 58% from 2005 through 2010.
The key question(s) then are “Why has US corn export demand stagnated and can that trend be reversed going forward?”
To best answer those questions we first have to assess what’s changed in the World corn exports market since 2010. I’ve identified what I believe to be the 2 largest contributing factors.
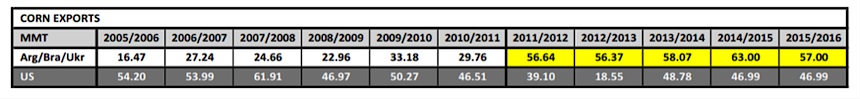
1) Higher CME corn futures prices fostered acreage expansion and better farming practices in Brazil, Argentina, and Ukraine (the world’s 3 largest non-US corn exporters).
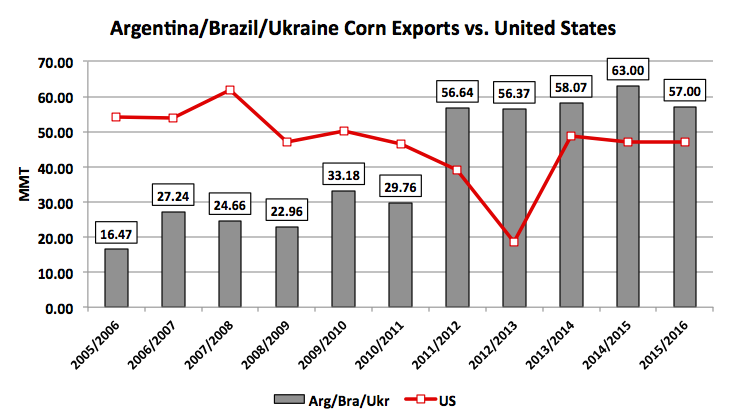
Consider the following: The average spot corn futures price in 2009/10 was $3.70 per bushel. The average spot corn futures price by crop year from 2010/11 through 2012/13 was $6.623 per bushel (2010/11 = $6.473, 2011/12 = $6.602, 2012/13 = $6.793). Therefore without question almost overnight the market provided an incredible pricing incentive to not only plant more corn but also to invest in better farming practices in an effort to optimize yield potential. The result was total combined corn exports from Brazil, Argentina, and Ukraine in 2011/12 of 56.64 MMT versus just 29.76 MMT the year prior, a remarkable 90% increase (or +1,058 million bushels). Since then, total cumulative crop year corn exports from those 3 countries have averaged 58.2 MMT versus an average of 40.1 MMT for the United States.
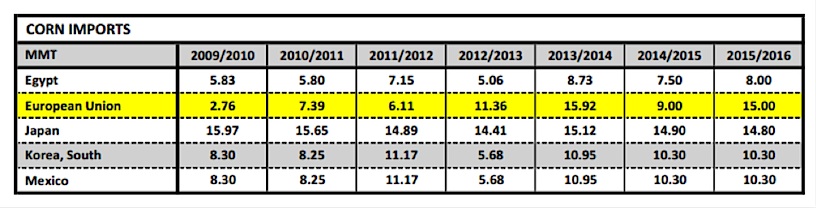
2) World corn import demand has trended sideways in a number of key countries due to a variety of factors including higher corn prices and cheaper feed alternatives.
In 2009 the 4 largest corn importers in the world were Japan, South Korea, Mexico, and Egypt. Collectively they imported 38.4 MMT during the 2009/10 crop year. Fast forward to present, in 2015/16 those same 4 countries are expected to import 43.4 MMT, an increase of just 13% (or 197 million bushels). The one bright spot has been the emergence of the European Union as a major world corn importer with its total crop year imports increasing from 2.76 MMT in 2009/10 to an estimated 15 MMT in 2015/16. However other than the EU, world corn import growth has basically been stymied in the other major corn importing countries. Why is that? Higher world corn prices, skittish world equity markets, economic uncertainty (which influences dietary shifts and meat consumption) and cheaper feed alternatives (distiller’s dried grains) all have been key contributors.
What will be required to increase US corn exports over the next 3 to 5-years?
I think the evidence suggests that for US corn exports demand to push back over 2,000 to 2,200 million bushels world corn prices will have to trade back under $4.00 per bushel for a prolonged period of time. That trend is already starting to take place. The average CME spot corn futures price for 2014/15 was approximately $3.73 per bushel. The reality is the market incentive to not only expand planted corn acreage but also maximize input costs has to be reduced significantly to force the less efficient world corn producers and exporters back to the sidelines. Brazil’s “safrinha” corn crop is a perfect example. Traditionally Brazil’s second, or safrinha, corn crop served as a cover crop planted after early maturing soybeans. However following the explosion in corn prices from 2010 through 2013, Brazilian producers started looking to generate a return on these additional bushels. The result has been a tremendous increase in safrinha corn production, which as of 2014/15 represented more than 60% of Brazil’s total all-season corn production. Therefore given Brazil’s current standing as the 2nd largest corn exporter in the world, if safrinha corn producers look to trim input costs to compensate for lower projected returns it should result in greater yield variability (and decreased production) over time. In theory this should lower Brazil’s net exportable corn surplus, and in doing so potentially drive business back to the United States.
This is simply one type of macro-related trend change that I believe will prove necessary to once again jump start US corn exports demand back to levels last experienced from 2005/06 through 2008/09.
Thanks for reading and have a great week.
Twitter: @MarcusLudtke
Data References:
- USDA United States Department of Ag
- EIA Energy Information Association
- NASS National Agricultural Statistics Service
Any opinions expressed herein are solely those of the author, and do not in any way represent the views or opinions of any other person or entity.

 Testing Important Price Support")
: Cup (and Maybe Handle) Watch")

