Necessary Evils: WHAT CORN MARKET HEDGERS NEED BUT MAY NOT KNOW IT
With March corn futures posting its lowest 1st trading day of January close since 2006 this past Monday I think it’s time to admit that the corn market has become a shadow of its former self. And while true corn market fundamentalists will immediately point to a host of bearish supply and demand factors (including 2015/16 U.S. corn stocks of 1,785 million bushels and World corn stocks of 211.9 MMT) as the primary reasons corn remains unable to gain any traction, I’m more inclined to believe it has substantially more to do with 3 key macro-market influences.
Consider the following:
In the December 2014 and January 2015 WASDE reports 2014/15 U.S. Corn ending stocks were estimated at 1,998 and 1,877 million bushels respectively. Both of those forecasts were materially HIGHER than the USDA’s current 2015/16 projection and yet March corn futures still managed to post a day high of $4.08 ½ on January 6th, 2015, approximately 50-cents per bushel above present values. What’s changed over the last 12 to 18-months to warrant a 13% price skew despite similar underlying market fundamentals?
Here’s a few things that are weighing on the corn market:
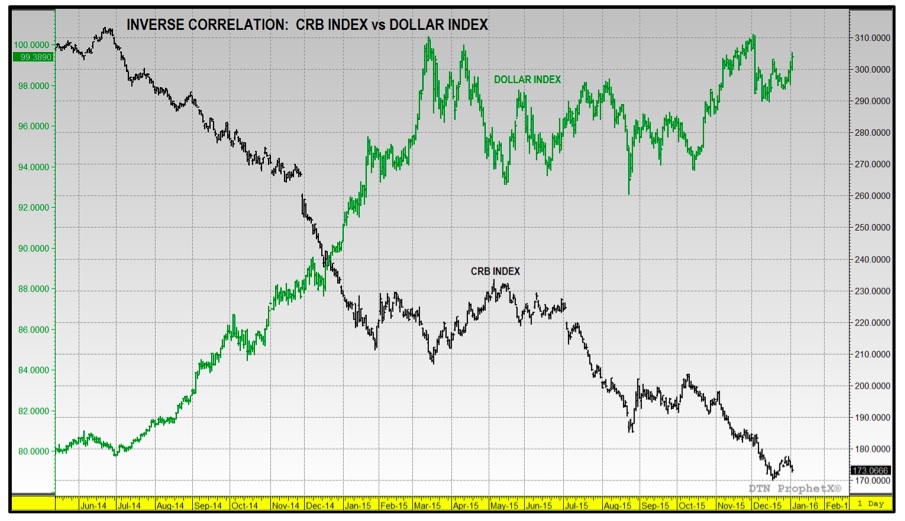
- There has been a broad based commodity price sell-off highlighted predominately by an incredible drop in energy values. Just 18 months ago crude oil futures were trading over $100 per barrel with natural gas futures trading just 20-cents shy of $5.00 per mmBtu. Roll forward to December 2015 and on 12/21 crude oil futures were in the process of carving out a 6-year low of $33.98 per barrel (lowest price since February 2009; crude prices have since moved lower in January) with natural gas futures dipping to an even more impressive 16-year low of $1.684 per mmBtu on 12/18 (lowest price since March 1999). And finally over that same time period the Thomson Reuters/CoreCommodity CRB Index (weighted 80% toward energy and agricultural commodities) traded from a high of 307.4 on 7/1/2014 down to a low of 170.1 on 12/17/2015.

- The Dollar Index has continued to strengthen consistently since establishing a day low of 79.74 on July 1st, 2014 eventually trending up to a 12-year high of 100.51 on December 2nd, 2015. Dollar strength historically has had a strong inverse correlation with the direction in commodity prices. This relationship has been on near perfect display over the last 18 months (see chart on page 3 of the CRB Index versus the Dollar Index). From a pure economic perspective to remain competitive in the world export market U.S. commodity values have been forced to compensate for Dollar strength with extremely lower values. Therefore the U.S. Dollar has played a significant role in pressuring Ag and Energy prices to new 5 and 10-year lows. Conversely when corn futures and crude oil futures were establishing new record highs from 2008 through 2012, the Dollar Index was trading consistently at near all-time lows (record low on 3/17/2008 of 70.698), which in turn incentivized traders to buy commodities as a hedge against inflation.
- The Managed Money position (M$) in corn futures has evolved considerably over the last 3 years with traders not only taking smaller positions, but also showing a more negative price bias. From June 2006 to June 2013 there were only two different time periods when money managers carried a net short in corn, and in both cases, the total M$ net short never exceeded -21,000 contracts nor was the position held longer than 3 weeks. Therefore over a period of 364 weeks total the Managed Money position in corn was only net short 5 weeks combined or 1% of the time. Furthermore from August 2010 through September 2012 money managers accrued new record net long positions in corn in excess of +300,000 and +400,000 contracts on several occasions. This period of time was also synonymous with the $7.00 and $8.00 per bushel corn market with the current record high established on 8/10/2012 at $8.43 ¾ per bushel. Coincidentally, in 2012 the peak for the M$ long position in corn was reported on August 21st (just 7 days after the new record high) totaling +342,893 contracts.


Flash forward to June 2013 through the present (12/29/2015) and what we have is a completely different mindset from Money Managers on the corn market. Over this period, consisting of 135 weeks total, money managers have carried a net short position in corn for 52 weeks combined or 39% of the time.
continue reading on the next page…


