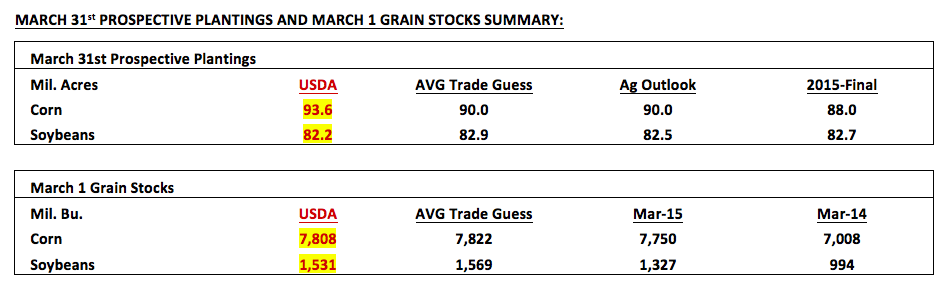
The USDA did not disappoint for those traders hoping for the unexpected and a market shock via the March 31st Prospective Plantings report. 2016 U.S. planted corn acreage was forecasted at 93.601 million acres, which was 3.6 million acres ABOVE the average trade guess and 5.6 million acres higher than a year ago.
The corn market reacted aggressively, turning sharply lower immediately after the USDA’s acreage projections were issued at 11:00 a.m. CST on Thursday. December corn futures finished Thursday’s session closing down 15 ¼-cents per bushel at a new contract low of $3.68 ¾. The closing price adjustment was the biggest one-day price swing in December corn futures since June 30th, 2015, which coincidently marked the release of the USDA’s June 30th Planted Acreage report.
Let’s be clear the planted corn acreage estimate was well-above even the high end of any pre-report private trade guesses. The USDA in its remarks defended the acreage increase “due to the expectation of higher returns (for corn) in 2016 compared with other crops.” I’m having a hard time justifying that rationale based on my own internal analysis, which continues to suggest that if a producer rents farmland in Minnesota or Iowa, his/her cost per acre is still approximately $800 per acre. The quick math then suggests that even if yields average 200 bushels per acre in 2016 in MN/IA, the breakeven cash price for farmers is still something close to $4.00 per bushel. It should be noted that both Iowa and Minnesota’s current RECORD corn yields were established in 2015 at 192 and 188 bushels per acre respectively. Point being, 200 bpa would represent a very good yield, requiring exceptional summer growing conditions. Anything less than that would then drive up the average breakeven price per bushel required for producers (185 bpa B/E price equals $4.32 per bushel).
Fast forward to present and with December 2016 corn futures now trading in the low $3.60’s and with end-users bidding approximately 25 to 30-under for new-crop corn (Oct-Nov 2016) in various sections of Minnesota and Iowa (-25 to -30 cents per bushel below the prevailing December corn futures price), I don’t see what the current market incentive is for producers to plant one more acre of corn than they did a year ago, specifically in those 2 states. Why are Minnesota and Iowa important in the national equation of total U.S. corn production? Collectively they account for 22.1 million planted corn acres or 24% of the total U.S. corn acreage base. Furthermore the USDA has corn acreage expanding 500,000 acres combined in MN/IA in 2016 when the economics seem to suggest a contraction is warranted.
Considering this will corn futures prices continue to track lower and lower in spite of a planted corn acreage forecast that many would argue defies logic?

Two Vastly Different Corn Growing Seasons with Nearly the Same Result: 2015 versus 2014
A quick analysis of the final U.S. corn yields from the past 2 growing seasons, which featured the 1st and 2nd highest yields in history (171 bpa in 2014 and 168.4 bpa in 2015), would seem to suggest consecutive summers of completely benign weather conditions across the entire Corn Belt. However for those of us that call the upper Midwest home we know that to be untrue. In 2014 the Eastern Corn Belt enjoyed above to sharply above-trend corn yields with Illinois, Indiana, and Ohio all establishing new record high yields of 200 bpa, 188 bpa, and 176 bpa respectively. In 2015 however it was the Western Corn Belt’s turn to rewrite the record books with Iowa (192 bpa), Nebraska (185 bpa), and Minnesota (188 bpa) achieving new record yields. That said specifically in 2015 if you were a producer in Illinois, Indiana, or Ohio, last year’s corn crop was in most instances a major disappointment with yields off more than 15% on average versus 2014 in those 3 states combined. What’s the significance for Corn Bulls? I would argue the biggest takeaway is that in 2015 we learned that even with below-trend yields in the 2nd (Illinois) and 5th (Indiana) largest corn producing states in the country, the U.S. is still capable of producing a near-record corn crop with good-to-excellent growing conditions in the 1st (Iowa), 3rd (Nebraska), and 4th (Minnesota) largest corn producing states. This unfortunately serves as yet another price deterrent to sustainable corn rallies. Prior to the last 2 years the widespread belief was that achieving a national corn yield in excess of 165 bpa required good-to-excellent crops in all 5 of those key states. We’ve since learned even that isn’t a mandatory requirement.


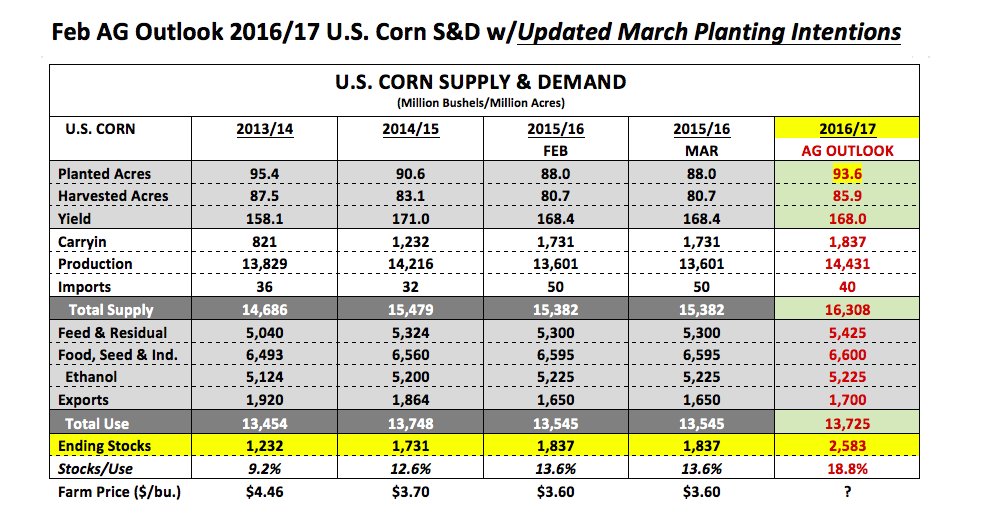
Here’s the problem for Corn Bulls: Even a well-articulated and verifiable response from Corn Bulls that discounts the USDA’s March forecast won’t change the number. I’ve tried this in the past and eaten my share of humble pie in the process. The 93.6 million in planted corn acreage will be the number the USDA plugs in its initial 2016/17 U.S. corn S&D table, which will be issued on May 10th, 2016. Furthermore when I simply incorporate the USDA’s latest March acreage estimate into their yield (168 bpa) and demand assumptions (total demand of 13,725 million bushels) from the February Outlook conference the carryout now pencils back at 2,583 million bushels. That would be the largest ending stocks figure in theory since 1987/88. Now I’m not suggesting that’s what the market will see in the May 2016 WASDE report. My guess is the USDA will lower harvested acreage; possibly reduce the yield 1 to 2 bpa, while also increasing total demand, all in an attempt to neutralize the net influence of the huge acreage increase on 2016/17 U.S. corn ending stocks. Their goal will be to keep the carryout at or below 2,000 million bushels. That said from now until May 10th the market has plenty of time to “think” about how negative that stocks figure could be. Typically when this happens the market bleeds lower…albeit slowly over time.
What will it take for December corn futures to hold in the $3.60 area? November 2016 soybeans will need to move higher. In most of the big corn producing states (for example, Iowa, Minnesota, and Illinois) corn competes with soybeans for acres. If the economics continue to shift aggressively in favor of planting soybeans (due to November soybean futures rallying), this could force December corn futures to maintain some sort of tangible price relationship to insure not “losing” too many acres. The USDA estimated 2016 U.S. planted soybean acreage at 82.2 million acres, 700,000 acres BELOW the average trade guess. On Thursday as December 2016 corn futures were closing down 15 ¼-cents per bushel, November 2016 corn futures closed up 1 ¾-cents per bushel. This price skew resulted in the new-crop soybean/corn price ratio closing at 2.51 on Thursday versus 2.40 the day prior. Historically that ratio needs to exceed 2.60 to generate a material acreage shift back to soybeans. Therefore this could provide residual support to corn prices in the process, irrespective of how negative U.S. corn fundamentals appear.
Therefore I’m watching November soybean futures to see if they can hold $9.20; if they can the chances of December corn futures holding $3.60 improve.
Misc Charts & Insights

Thanks for reading.
Further reading from Marcus: “Corn Enters Critical Period Of Price Seasonality“
Twitter: @MarcusLudtke
Author hedges corn futures and may have a position at the time of publication. Any opinions expressed herein are solely those of the author, and do not in any way represent the views or opinions of any other person or entity.
Data References:
- USDA United States Department of Ag
- EIA Energy Information Association
- NASS National Agricultural Statistics Service

: Cup (and Maybe Handle) Watch")
 Reaches Important Price Support")

