March corn futures moved slightly higher this week, closing up a ½-cent per bushel week-on-week, finishing on Friday (1/13) at $3.58 ½. The market focus all week was on the USDA’s January 12th WASDE report, which contained not only the U.S. and World supply and demand revisions from December, but more importantly finalized 2016 U.S corn and soybean production figures both nationally and state-by-state.
A full summary of the report is as follows:
USDA JANUARY 12th WASDE REPORT SUMMARY:
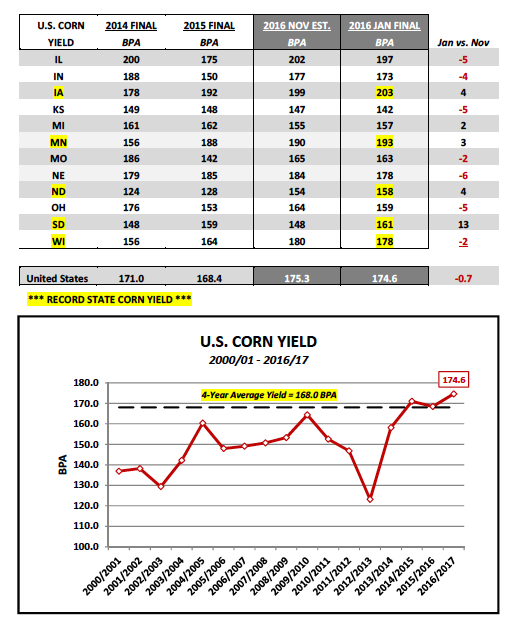
- RECORD U.S. CORN YIELD AND PRODUCTION – Thursday’s report revealed only minor tweaks to the U.S. corn balance sheet. In corn the USDA lowered the 2016/17 U.S. corn yield -0.7 bpa versus November to 174.6 bpa. However that yield figure still represented a crop-year record high, exceeding the previous high-water mark of 171.0 bpa from 2014/15. Total U.S. corn production was forecasted at 15,148 million bushels versus 15,226 million in November and the average trade guess of 15,196 million. Again despite production falling slightly below the average trade guess, it too reflected a new record high, eclipsing the prior record from 2014/15 by an incredible 932 million bushels.
- RECORD STATE CORN YIELDS – A number of the major U.S. corn producing states experienced record growing seasons in 2016; however none bigger than Iowa and Minnesota. Iowa achieved a final state corn yield of 203 bpa versus its previous record of 192 bpa. This resulted in Iowa corn state production of 2,741 million bushels. Minnesota’s state corn yield was finalized at 193 bpa versus its previous record of 188 bpa. Minnesota’s state production was 1,544 million bushels. Therefore collectively Iowa and Minnesota’s combined 2016 corn production totaled 4,285 million bushels, which as a point of reference would theoretically make those 2 states the 3rd largest corn producer in the world by country (trailing the U.S. as whole and China, while exceeding the next largest corn producing country of Brazil whose 2016/17 production is currently estimated at 3,405 million bushels). The other major corn producing states achieving record yields in 2016 were North Dakota (158 bpa), South Dakota (161 bpa), and Wisconsin (178 bpa).
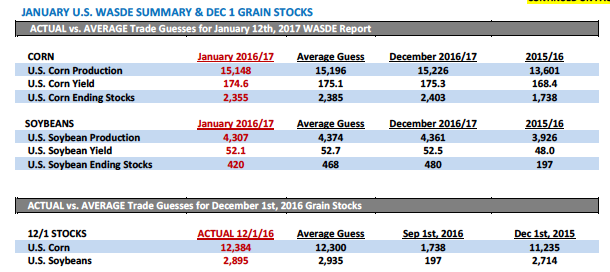
- MASSIVE U.S. CORN ENDING STOCKS – 2016/17 U.S. corn ending stocks were lowered to 2,355 million bushels versus 2,403 million in December. The USDA did increase corn-ethanol demand 25 million bushels to 5,325 million, which seems appropriate following yet another weekly ethanol production record of 1.049 million bpd reported on Wednesday. That said the USDA did NOT increase U.S. corn exports leaving them unchanged at 2,225 million bushels even with year-to-date sales exceeding last year by +72% as of the week ending 1/5/17. Overall the revised ending stocks estimate still reflects a 29-year high, offering continued overhead price pressure on rallies (see U.S. corn stocks chart on page 4).
- WORLD CORN HIHGLIGHTS – 2016/17 World corn stocks dipped slightly month-on-month to 221 MMT versus 222.3 MMT in December; however that figure still represented a crop-year record high, exceeding the previous record by approximately 11 MMT or 433 million bushels. Key South American corn production estimates for both Brazil and Argentina were left unchanged at 86.5 MMT and 36.5 MMT respectively, with combined Bra/Arg exports forecasted at 53 MMT versus just 36.7 MMT in 2015/16. This in part likely explains the USDA’s hesitancy in increasing its current 2016/17 U.S. corn export forecast given the fact that the majority of South American corn export displacement occurs the 2nd half of the marketing year (March – August).
- RECORD U.S. SOYBEAN YIELD AND PRODUCTION/ STOCKS SUMMARY – The U.S. also scored a new record high national soybean yield in 2016/17 of 52.1 bpa. This figure was down slightly from the November estimate of 52.5 bpa; however it still smashed the previous record of 48 bpa, which was established just one crop-year ago. Total production was projected at 4,307 million bushels, 380 million bushels or 9.7% above the prior record of 3,927 million bushels from 2014/15. One price support from the report was arguably 2016/17 U.S. soybean ending stocks falling to 420 million bushels, down 60 million from December and 48 million bushels below the average trade guess. December 1 soybean stocks of 2,895 million bushels also offered mild price support with that figure coming in 40 million bushels below the average trade guess of 2,935 million. HOWEVER…some perspective needs to be offered in that the revised U.S. soybean carryout projection still exceeds 2015/16 U.S. soybean ending stocks by 223 million bushels with December 1st, 2016 soybean stocks also 181 million bushels ABOVE 12/1/15 levels. Therefore I wouldn’t gravitate toward the narrative suggesting U.S soybean S&D revisions were “bullish.” Rather they were supportive given trade expectations in a market that still appears range bound to the upside.
continue reading on the next page (Corn Price Outlook)…


 Rolling Over At Key Fibonacci Level?")


