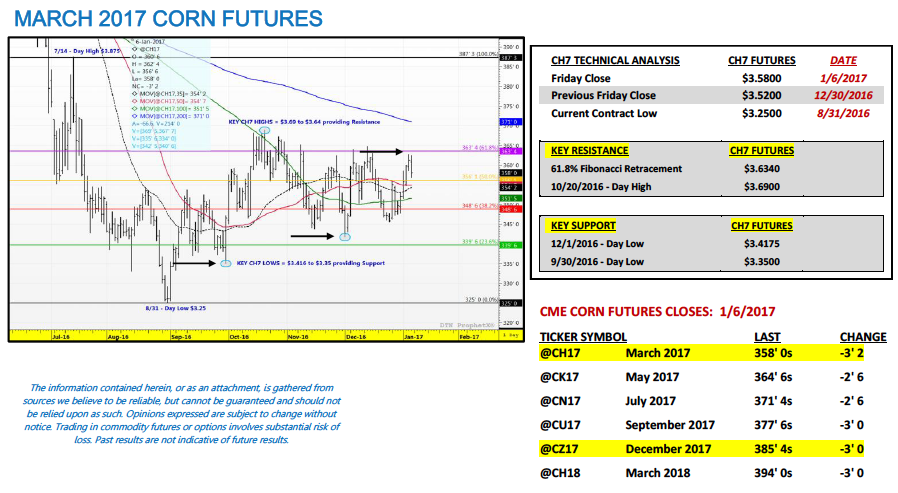
March corn futures moved slightly higher this week, closing up 6-cents per bushel week-on-week, finishing on Friday (1/6) at $3.58. Despite the higher weekly price action, Friday’s 3 ¼-cent lower close was yet another indication CH7 still has strong overhead, technical resistance in the $3.64 to $3.69 per bushel ranges.
Weekly Highlights:
U.S. Corn Export Inspections: Weekly U.S. corn export inspections totaled 25.07 million bushels for the week ending 12/29/2016, exceeding the 14.9 million bushels shipped for the same week a year ago. Crop year-to-date U.S. corn export inspections improved to 671.5 million bushels, 79.4% ahead of 2015/16. Overall despite a strong Dollar (which scored a new 15-year day high on 1/3), U.S. corn export sales and shipments remain strong. This continues to suggest an increase to the USDA’s current 2016/17 U.S. corn export forecast of 2,225 million bushels is likely warranted in the January 12th WASDE report. That said I’m anticipating an export increase of 25 to 50 million bushels.
Record High U.S. Ethanol Production: On Thursday (1/5) the Energy Information Administration reported daily ethanol production of 1.043 million barrels per day for the week ending 12/30/2016. This was a new record high, exceeding the previous high water mark of 1.040 million bpd, established just 3 weeks prior. Despite record production, U.S. ethanol stocks actually declined slightly week-on-week to 18.678 million barrels, just 230k bpd higher than the calendar year LOW for ethanol stocks of 18.448 million barrels on 11/25/2016. As it relates to corn….2016/17 U.S. corn-ethanol demand was last estimated at 5,300 million bushels in the December WASDE report. For the current Crop-Year (2016/17), weekly U.S. ethanol production has now averaged 1.008 million barrels per day (Sep-Dec). This average equates to annualized ethanol production of 15.5 billion gallons and U.S. corn-ethanol demand of approximately 5,400 million bushels, +100 million versus the USDA’s current forecast. Therefore ethanol production continues to offer good underlying price support to corn futures.
CHINA’S CORN Conundrum
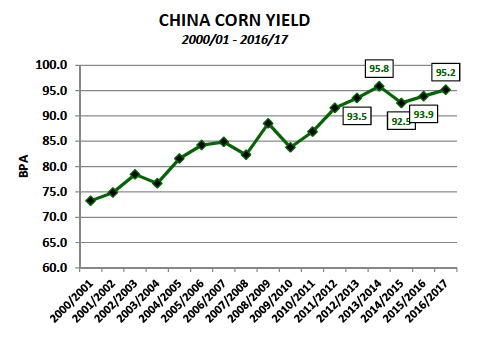
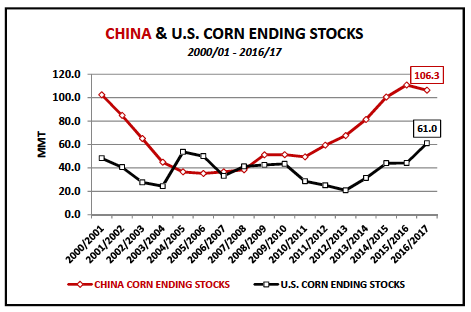
The road to higher corn prices in 2017 will invariably pass through China. China is the world’s second largest corn producer with 2016/17 production totaling 219.6 MMT or 8,643 million bushels. China trails only the U.S. as it relates to producing corn. In fact it’s essentially a two-horse race (U.S. = Secretariat at 386.75 MMT or 15,226 million bushels) with Brazil the world’s 3rd largest producer at just 86.5 MMT or 3,405 million bushels. Secondarily China’s corn ending stocks estimate for 2016/17 of 106.3 MMT or 4,185 million bushels accounts for nearly 48% of the current record high World corn ending stocks forecast of 222.3 MMT. When combined with U.S. corn ending stocks for 2016/17 of 61.0 MMT, China and the U.S. represent 75.3% of total World corn ending stocks. Therefore from purely a fundamental point of view, when it comes to assessing the primary World corn S&D related factors currently weighing on corn futures it’s not only the U.S. corn balance sheet limiting rallies. China’s burdensome corn stocks profile has also proven to be a major contributing factor.
That said China is now taking measures to reduce its massive state-owned corn stocks, which have depressed domestic prices for its producers and placed additional stress on China’s rural economy. Over the last 3-weeks there have been a number of press releases detailing China’s policies to grow its domestic corn usage in 2017 while also trimming planted corn acreage. Reuters recently reported that China has intentions of increasing production of both biodegradable plastics and ethanol both made from corn, while also increasing corn feed use. On the supply side, China’s Ag Minister reiterated a plan to cut planted corn acreage in 2017 by 667,000 hectares or 1.5 million acres. And while none of these measures will serve as an immediate fix to bringing China’s corn supplies and ending stocks figures back into more of a sustainable alignment, it does serve at the very least as a public acknowledgement from the Chinese government that policy changes are needed this year.
How big of a role will China’s corn S&D play in influencing CME corn futures price direction going forward? In my opinion China will always be “a factor” but rarely “the factor” regarding offering either primary price support on rallies and/or downward price pressure on corrections. Given China’s population of nearly 1.4 billion people and the fact that China’s corn feed and residual use is the largest in the world at 159 MMT (6,260 million bushels), they will always be part of the corn futures price conversation. Invariably there are a lot of mouths to feed. That said over the last 3-crop years, despite near record corn ending stocks, Chinese corn exports have essentially been non-existent, averaging just 0.01 MMT or 0.5 million bushels. This jives with China’s government policies, which have been molded to attain self-sufficiency in corn production and domestic corn use versus creating a sustainable export market. Therefore, considering corn futures prices are most often driven by the production uncertainties in the key world corn exporting countries (i.e. U.S., Brazil, Argentina, and Ukraine); China will likely continue to be more of an underlying/secondary price support or resistance factor versus the lead catalyst.
KEY PRICING CONSIDERATIONS FROM MARCH CORN FUTURES (CH7) WEEK ENDING 1/6/2017: March corn futures (CH7) closed on Friday (1/6) at $3.58 finishing up 6-cents per bushel week-on-week.
Key takeaways from this week’s price action:
- Technically March 2017 corn futures continue to find resistance at the upper end of the current trading range from $3.64 to $3.69 per bushel. Therefore even “higher” weekly closes have to yet to provide any feel of a legitimate trend change to sustainably higher prices above the 200-day moving average of $3.71. That said the current pricing pattern of sideways, range bound moves remains intact and will likely stay that way until the market can move beyond the USDA’s January 12th WASDE report. Downside support should come in the form of the 100-day moving average at $3.517.
- The one price support in corn that did receive attention early in the week (and will likely remain a factor for the next several weeks) was a report that the major commodity indexes (S&P GSCI and Bloomberg Commodity Index) will be buyers of an estimated 60,000 to 70,000 corn contracts in 2017. Commodity indexes rebalance their commodity specific position exposures typically every January, and this year the expectation is they will be sizable buyers of both corn and wheat futures.
Ultimately Corn Bulls will have to be patient until the dialogue in corn can shift beyond the record 2016 U.S. corn crop, which should start to begin after the January 12th WASDE report. In that report the USDA will finalize the 2016 U.S. corn yield and total production figures. Therefore corn buyers will no longer have to fear that another major yield increase is looming in future WASDE reports. The conversation will then transition almost exclusively to South American weather (which is looking slightly more price supportive) and also 2017 U.S. planted corn acreage. The USDA’s Baseline acreage estimates released just over a month ago forecasted 2017 U.S. planted corn acreage down 4.5 million acres. All of this will help corn’s upside prospects of breaking out of and over current topside price resistance in the $3.64 to $3.71 per bushel ranges.
Thanks for reading.
Twitter: @MarcusLudtke
Author hedges corn futures and may have a position at the time of publication. Any opinions expressed herein are solely those of the author, and do not in any way represent the views or opinions of any other person or entity.
Data References:
- USDA United States Department of Ag
- EIA Energy Information Association
- NASS National Agricultural Statistics Service

: Worrisome to Broader Market?")

