July corn futures closed DOWN 16 ½-CENTS per bushel week-on-week, finishing at $3.61 ¼.
Below are some weekly highlights and market themes to watch in the corn market this week:
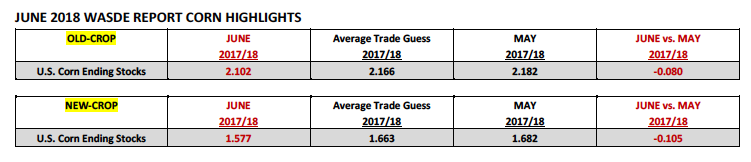
On Tuesday the USDA released its June 2018 WASDE report, which offered some much needed support for Corn Bulls.
In that report the USDA lowered 2018/19 U.S. corn ending stocks 105 million bushels month-on-month to 1.577 billion bushels. That figure was also below the average trade guess of 1.663 billion bushels. The downward ending stocks revision was attributed to an 80 million bushel decline in carryin stocks, as well as, a 50 million bushel increase to corn-ethanol demand. There was a 25 million bushel cut to feed and residual use, which limited the negative stocks adjustment to the aforementioned 105 million bushels. Corn futures responded by closing up 10 ¼-cents per bushel versus the July on Tuesday afternoon, finishing at $3.77 ½.
How Bullish were the changes to the U.S. corn balance sheet longer-term?
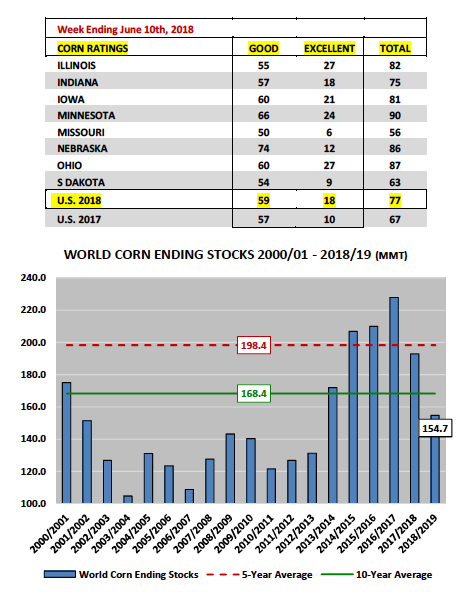
When you consider that going into the report corn futures had been enduring a fairly aggressive sell-off from recent calendar year highs in excess of 45-cents per bushel (inspired in part by significant Managed Money long liquidation), the USDA’s lower than expected carryout figure was seen more so as a convenient price stabilizing surprise in what was a downward trending market. For the past two weeks the narrative in the corn market had been dominated almost exclusively by the strong start to the 2018 U.S. growing season. Monday’s Crop Progress report only served to reinforce that view with the U.S. corn crop rated 77% good-to-excellent versus 67% a year ago. This resulted in July corn futures trading down to a day low of $3.66 ¾ on Monday, the lowest CN8 had traded since January 24th.
The lack of a legitimate Midwest weather threat coupled with several private analysts already anticipating a U.S. corn yield increase coming in the July 2018 WASDE report has had corn futures on the defensive since the last few trading days of May.
That said for corn futures to sustain and build on Tuesday’s rally moving forward Corn Bulls will have to overcome two supply-side hurdles in the coming weeks.
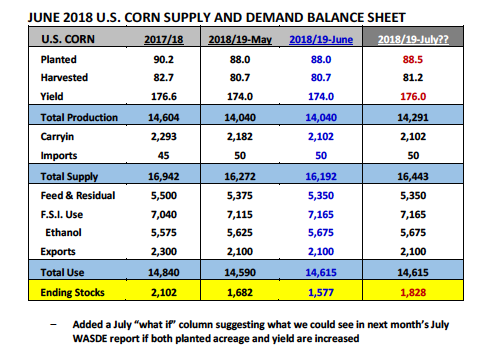
The first being the USDA’s June 29thAcreage report. In that report the USDA will reassess its March Prospective Plantings forecast of 88.03 million corn acres. I believe that acreage figure could go up by at least 500,000 acres due to an accelerated spring planting pace in the Eastern Corn Belt. The second will be the USDA’s July 2018 WASDE report, released on 7/12. Several private analysts have already penciled in a 2018/19 U.S. corn yield of 176 bpa versus the USDA’s June forecast of 174 bpa.
The combination of more acres (+500k) and a higher yield (+2 bpa) would theoretically raise 2018/19 U.S. corn production approximately 250 million bushels versus the USDA’s June estimate of 14.040 billion bushels. If we assume no changes to U.S. corn demand, 2018/19 U.S. corn ending stocks would improve to approximately 1.830 billion bushels (see page 2). Therefore…barring a significant shift in the weather pattern, in my opinion those are the two biggest obstacles to July corn futures sustaining rallies back to $3.85 / $3.95 in the short-term (even with this latest cut to U.S. corn ending stocks in the June report).
The other price supportive win for Corn Bulls in the June 2018 WASDE report was the USDA’s decrease to World corn ending stocks.
2018/19 World corn ending stocks were lowered to 154.7 MMT versus 159.2 MMT in May and 192.7 MMT in 2017/18. Furthermore since 2016/17 World corn ending stocks have declined 73.2 MMT or approximately 32%. That’s a concerning trend and one that I do think will require the proper market incentives to add corn acres in 2019. That said with 2018/19 World corn days of use now projected at just 51 days, the lowest since 1974, it will be interesting to see how effective Corn Bulls are at making that storyline more relevant as it relates to generating upward price moves nearby.
JULY CORN FUTURES TRADING OUTLOOK
Politics “trumped” market fundamentals this week with both corn and soybeans futures casualties of a vicious downward spiral, a byproduct of the looming tariff standoff between the U.S. and China.
The deadline for a compromise was June 15th. On Friday, with no middle ground achieved, President Trump followed through with tariffs on $50 billion of Chinese products. China retaliated with matching tariffs on $50 billion of U.S. imports including a 25% tariff on U.S. soybeans and corn. Why is this such a big deal? China is the world’s largest importer of soybeans and accounts for more than half of all U.S. soybean exports (+1.1 billion bushels). And although they’re not a significant importer of U.S. corn; with July soybean futures closing down nearly 64-cents per bushel week-on-week, corn futures clearly couldn’t avoid being consumed by the soybean futures jet wash.
The question is…now what? Honestly it’s hard to know. The reality is this is foreign territory for traders. And if we’ve learned anything from President Trump’s brief tenure in office it’s that he’s unpredictable. And for traders, who have built their careers studying and applying both technical and fundamental indicators, trying to anticipate the whims of two world leaders doesn’t necessarily fall under the jurisdiction of either application.
What I do know is this…Money Managers have zero appetite for major long or short position exposure when it comes to a trade war. Friday’s Commitment of Traders report showed the Managed Money long in corn shrinking by 77,383 contracts week-on-week and that was as of Tuesday’s close. Therefore that didn’t include Thursday and Friday’s push to new contract lows. The Managed Money net long had been reduced to +36,216 contracts as of 6/12. My guess is Money Managers are now close to even.
That said…would I suggest selling corn on what has been a 57-cents per bushel break since May 24th? No.
When I step back and analyze the rest of the market (excluding the “trade war”) my conclusions are this:
There’s no longer any weather premium in the market with sharply above-normal temperatures remaining in the 6 to 10-day forecast and the calendar reading June 15th.
- The World corn ending stocks figure is below both its 5 and 10-year averages.
- S. corn ending stocks are the tightest they have been since 2013/14 and that’s after applying a U.S. corn yield 174 bpa.
- Money Managers have essentially liquidated their long positions.
- Technically BOTH the corn and soybean markets are now oversold.
The reality is the market is one Trump tweet away and/or one Beijing summit away from going back the other direction. Stay tuned…
Twitter: @MarcusLudtke
Author hedges corn futures and may have a position at the time of publication. Any opinions expressed herein are solely those of the author, and do not in any way represent the views or opinions of any other person or entity.
Data References:
- USDA United States Department of Ag
- EIA Energy Information Association
- NASS National Agricultural Statistics Service

 Flirting With Critical Support… Again")
