Corn Market Summary For The Week Ending 3/11/2016:
July corn futures closed up 6-cents per bushel week-on-week, finishing at $3.69 ½ on 3/11. CN6 is quickly approaching both the 35 and 50-day moving averages, which are consolidating near $3.71 per bushel. As it stands, that area will pose as initial topside resistance for corn prices on Monday morning followed by the 100-day moving average at $3.791.
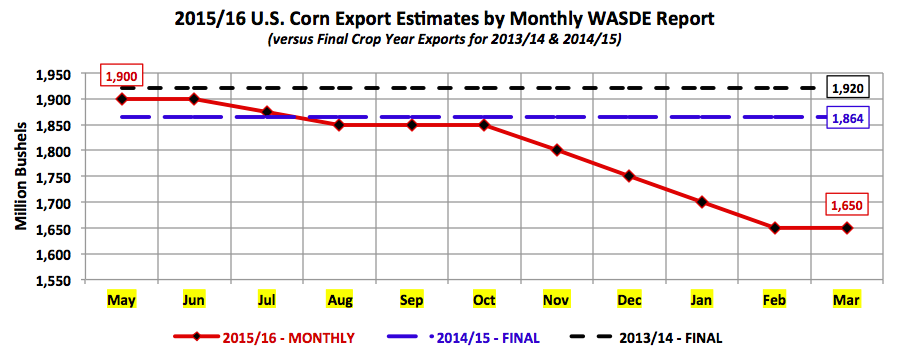
On Wednesday the USDA released its March 2016 WASDE report. The trade was anticipating a slight increase to 2015/16 U.S. corn ending stocks by virtue of yet another cut to exports. Since the USDA’s initial 2015/16 U.S. corn market balance sheet was released in May 2015 U.S. corn exports have been lowered 250 million bushels. However despite what has been a steady decline in its export forecast the USDA chose to leave that estimate unchanged in the March report at 1,650 million bushels. The graph below shows the USDA’s month-by-month adjustments to its U.S. corn exports projection for 2015/16 versus the U.S.’s total crop-year corn exports for 2013/14 and 2014/15.
The net result of the USDA’s updated 2015/16 U.S. corn S&D table for March was an unchanged U.S corn market ending stocks forecast of 1,837 million bushels versus an average trade guess of 1,854 million and 1,731 million in 2014/15. I’m not expecting the USDA to alter its carryout figure significantly in either of the upcoming April or May WASDE reports. Reason being, whereas U.S. corn exports have been cut 250 million bushels since May 2015, U.S. corn feed and residual use remains unchanged at 5,300 million bushels with U.S. corn-ethanol demand up just 25 million bushels (currently forecast at 5,225 million bushels versus 5,200 million in the May 2015 WASDE report). Therefore demand adjustments have largely been predicated by a relatively consistent downsizing of U.S. corn exports.
Will U.S. corn exports stabilize at 1,650 million or should future reductions be expected?
As of the USDA’s latest weekly export sales report (week ending 3/3/2016), year-to-date U.S. corn sales were running approximately 20% behind a year ago. If that pace continues that would suggest final 2015/16 U.S. corn exports closer to 1,500 million bushels versus the USDA’s March forecast of 1,650 million, which represents only an 11.5% decline versus 2014/15. Therefore an argument could easily be made that U.S. corn exports will be lowered in proceeding Crop reports.
Why then did the USDA hesitate on reducing exports in the March Crop report?
I’m going to assume the USDA is choosing to pause on additional decreases until more is known about the size and condition of Brazil’s safrinha corn crop, which represents approximately 65% of Brazil’s total crop year corn production. Safrinha corn planting is reportedly just nearing completion in both Mato Grosso and Parana. They represent the 1st and 2nd largest safrinha corn producing states in the country. The USDA left Brazil’s 2015/16 corn production and exports unchanged in the March WASDE report at 84 MMT and 28 MMT respectively. I have seen private corn production estimates in Brazil as high as 87.3 MMT from Agroconsult. Brazil remains the world’s 2nd largest corn exporter and key competitor for the United States corn market.
Overall, the March Crop report offered no new market moving revelations for corn prices. 2015/16 World Corn Stocks did decline 1.8 MMT to 207 MMT; however that figure is still record high. There remains a substantial supply cushion both in the U.S. and globally heading into the 2016/17 growing season.
Current Expectations For Corn Prices:
Corn futures managed a higher weekly close, which was critical for Corn Bulls considering December corn futures were just a week removed from carving out a new contract low of $3.73 ¼ on March 2nd. However this week’s higher price action did not come without considerable effort. December corn futures closed on Friday at $3.82 ¾, which represented just a 4 ¾-cent week-on-week price increase. Clearly this is not 2012 for the corn market, where daily moves were often measured in dimes or quarters.
This is 2016 and in today’s market environment consisting of surplus U.S. and World corn ending stocks I’m afraid we’re back to trading 20 to 30-cent ranges over weeks not days (barring any weather issues for the corn market).
continue reading on the next page for charts & analysis…


 Testing Important Price Support")


