There were a number of notable private U.S. Corn production forecasts issued this week. And we’ll get the USDA’s November 2016 WASDE report on Wednesday, November 9th. FCStone in particular issued a revised 2016/17 U.S. corn yield estimate of 175.3 bpa with total production pegged at 15,226 million bushels versus the USDA’s October projections of 173.4 bpa and 15,057 million bushels.
Record Corn Yields
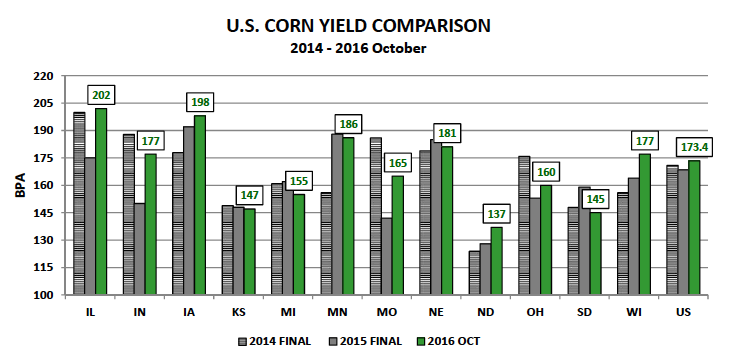
Upon closer examination and with approximately 75% of the U.S. corn harvest now complete as of October 30th, it’s becoming more and more apparent that a Bullish harvest surprise is likely not in the offing for the 2016/17 U.S. corn crop. And at or near record corn yields may be in the cards for some states.
A number of the private state-by-state yield estimates released this week still show Illinois and Iowa achieving record corn yields of 200 bpa or greater for 2016. That narrative has yet to change despite 91% of Illinois’s and 71% of Iowa’s corn acreage bases now harvested. Minnesota has also been added to that list of top five corn producers possibly in-line for record corn yields this fall with at least one reputable private forecaster projecting Minnesota corn yields at 190 bpa. If realized, this would exceed the previous record established just 1-year ago by 2 bpa.
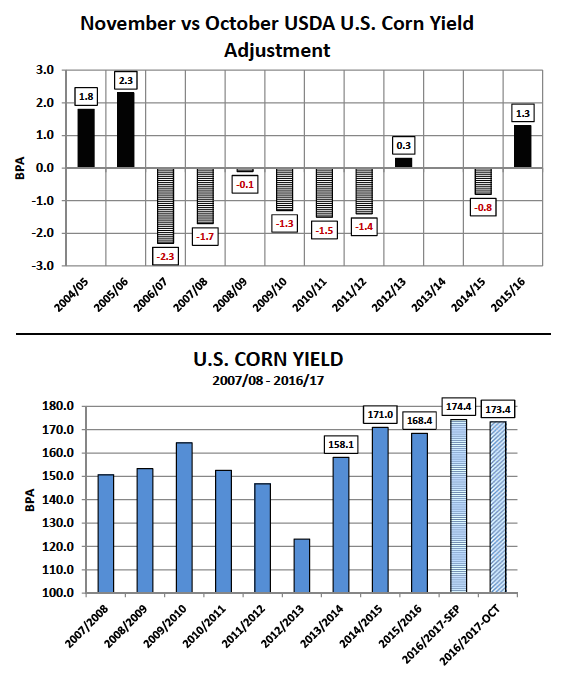
From 2004/05 through 2015/16 the USDA issued 7 U.S. corn yield decreases in the November WASDE report versus October, which averaged -1.3 bpa. The largest November yield reduction over that time period was -2.3 bpa in 2006/07. Conversely there were 4 U.S. corn yield increases averaging +1.4 bpa with the largest yield increase totaling +2.3 bpa in 2005/06. It should be noted that no WASDE report was released in October 2013 due to the federal government shutdown. Therefore based on recent historical precedent the USDA’s data would suggest that a U.S. corn yield between 171.1 to 175.7 bpa remains a likely outcome in next Wednesday’s November 2016 WASDE report (the October 2016 yield estimate was 173.4 bpa; therefore + or – 2.3 bpa accounts for the max yield adjustments up or down since 2004/05).
Applying those min/max yield projections for November, what would be the impact on total 2016/17 U.S. corn production and U.S. corn ending stocks (assuming no changes are made to harvested acreage of 86.8 million acres and/or total U.S. corn demand of 14,525 million bushels)? The U.S. corn production range equates to a low of 14,852 million bushels to a high of 15,251 million bushels versus 15,057 million in October. This would result in U.S. corn ending stocks of between 2,115 million bushels and 2,514 million bushels versus 2,320 million in October. The key takeaway from this quick analysis…even the low end yield estimate of 171.1 bpa isn’t nearly enough to move the needle on what would still represent a 29-year high in U.S. corn ending stocks at 2,115 million bushels. There’s your answer for why corn futures can’t sustain rallies above key resistance (i.e. the 100-day moving average in December corn futures).
Weekly U.S. CORN Export Sales Update:
U.S. corn export sales for the week ending 10/27/2016 totaled an impressive 58 million bushels. Year-to-date sales improved to 974.6 million bushels versus just 517.5 million a year ago, which represents a year-on-year increase of 88%. It’s important to note however that despite the accelerated rate of sales, current U.S. corn export shipments still trail the pace necessary to achieve the USDA’s latest 2016/17 U.S. corn export forecast of 2,225 million bushels. Therefore I would argue that what the U.S. is currently enjoying is a number of world corn importers hedging their 2016/17 needs via the U.S. market (through advanced “paper” ownership) until they have better view of the 2016/17 corn production prospects for both Brazil and Argentina. Brazil in particular, traditionally the world’s 2nd largest corn exporter, remains just one crop year removed from a 2015/16 corn crop that totaled 67 MMT, which was 18 MMT or 21% below the previous year.
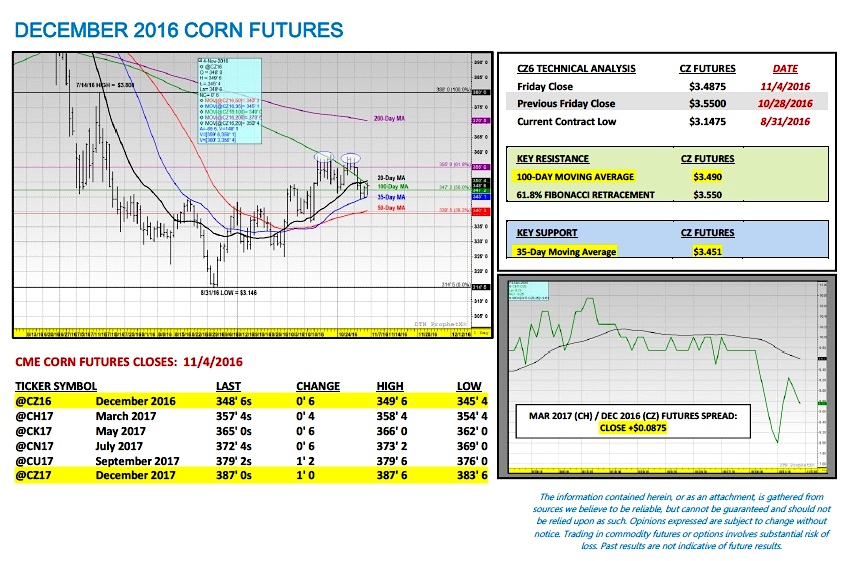
December Corn Futures (CZ6) Pricing Considerations:
December corn futures closed on Friday (11/4) at $3.48 ¾, finishing down 6 ¼-cents per bushel week-on-week. CZ6 failed to build on the previous week’s upward momentum, moving back under the 100-day moving average of $3.49. There remain a number of key fundamental resistance factors in play, which should continue to plague corn’s ability to sustain rallies back into the $3.70 to $3.80 price ranges into the end of 2016. They include:
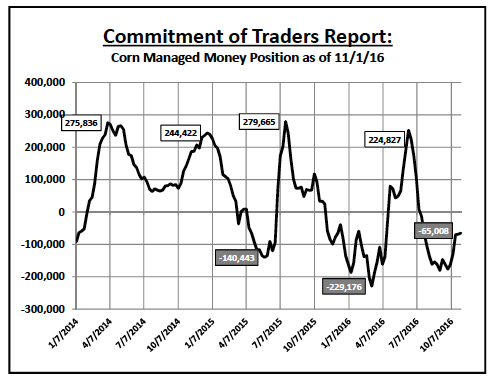
1). Money Managers continue to show an unwillingness and/or desire to liquidate their remaining net corn short. Friday’s Commitment of Traders Report reflected a Managed Money net corn short of -65,008 contracts as of the market close on 11/1/2016. From 9/27/2016 through 10/18/2016 Money Managers reduced their net corn short from -176,844 contracts to -69,978 contracts. Therefore they were net buyers of 106,866 corn contracts over that 3-week time span. Not surprisingly that buying coincided with December corn futures trading from a day low of $3.27 ¼ on 9/27 to a day high of $3.57 ½ on 10/18 (the highest December corn futures had traded since July). However over the last 2-weeks Money Managers have essentially stopped buying corn. They’ve been net buyers of only 4,970 contracts, which in turn culminated with the lower weekly close on Friday and a push back under critical support levels.
2). Late in the week Informa Economics joined the chorus of those still expecting a record U.S. corn yield for 2016/17. They revised their yield forecast to 174.0 bpa, which was down slightly from their projection in October, yet still higher than the USDA’s current estimate of 173.4 bpa. Informa projected total U.S. corn production of 15,109 million bushels versus the USDA’s October estimate of 15,057 million.
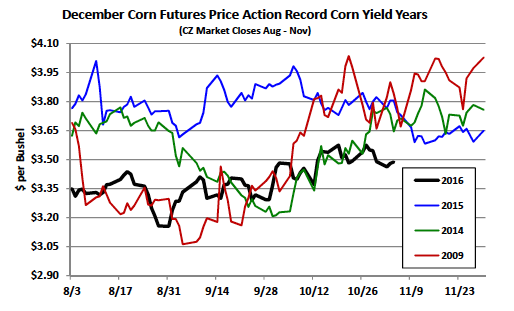
Ultimately until the market focus shifts to the possibility of a significant U.S. corn planted acreage reduction for 2017/18, corn futures have little fundamental justification for extended rallies above $3.70 to $3.80 per bushel. The 10-year price seasonal suggests a lower November month-end close in December corn futures versus the October 31st CZ6 close of $3.54 ¾.
Thanks for reading.
Twitter: @MarcusLudtke
Author hedges corn futures and may have a position at the time of publication. Any opinions expressed herein are solely those of the author, and do not in any way represent the views or opinions of any other person or entity.
Data References:
- USDA United States Department of Ag
- EIA Energy Information Association
- NASS National Agricultural Statistics Service


 Showing Bullish Buy Potential")


