DECEMBER corn futures closed up 2 1/4 CENTS per bushel week-on-week, finishing at $3.65.
Let’s review current themes, news, data releases, and trends for the week ahead (week of September 3):
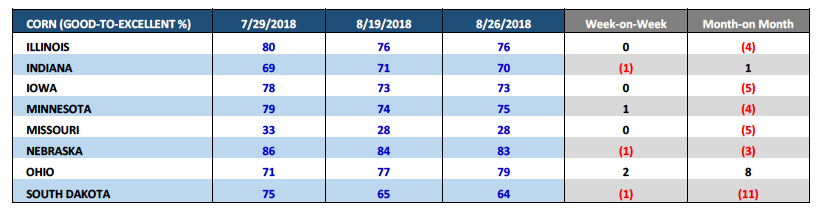
Monday’s Weekly Crop Progress report showed the U.S. corn good-to-excellent rating unchanged week-on-week at 68% versus 62% the same week a year ago.
Monday’s report, which provided the last weekly rating for August, however offered some additional insight regarding the change in good-to-excellent ratings versus July month-end. Since July 29thIllinois’s corn rating has fallen 4% (80% versus 76% on 8/26). Iowa’s rating is off 5% (78% versus 73% on 8/26) with Minnesota down 4% (79% versus 75% on 8/26). Nationally at the end of July the U.S. corn crop was rated 72% good-to-excellent. That said the U.S. corn good-to-excellent rating has slipped 4% during the month of August.
Will the U.S. corn ratings decline translate to the USDA lowering its 2018/19 U.S. corn yield estimate of 178.4 bpa in the September 2018 WASDE report (released on 9/12/18)?
I don’t think so. Historically some minor deterioration in ratings is both common and expected as the crop matures. Furthermore the market’s still just one week removed from Pro Farmer’s extensive crop tour, which ended with Pro Farmer forecasting a national corn yield of 177.3 bpa and total production of 14.501 billion bushels. That’s only a -1.1 bpa and -85 million bushel differential versus the USDA’s August estimates. Therefore the crop tour in many ways simply substantiated the USDA’s August findings.
That said, I can see several scenarios where the USDA leaves the yield unchanged with possible yield reductions coming in the November or January WASDE reports; however those downward adjustments will likely come post-harvest.
Long-term is there hope for Corn Bulls? Absolutely.
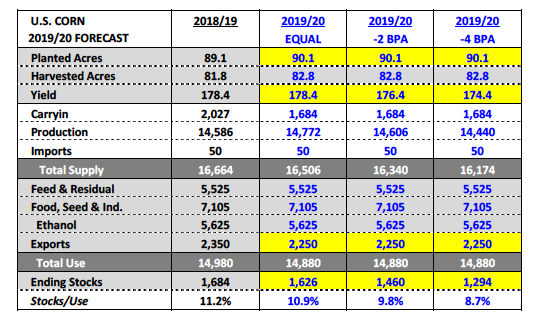
This week I started assessing the 2019/20 crop year and what the U.S. corn S&D could look like in the spring of 2019. That said I believe the pricing environment (in the absence of a continuing trade war with China) should be one of the best producers have seen in years (think 2013). If you start to factor in 2019/20 U.S. corn carryin stocks of just 1.684 billion bushels, which equates to a substantially lower supply cushion going into the 2019 growing season, it quickly becomes apparent that the market is going to have to incentivize producers to expand corn acreage by at least 1 million acres in 2019/20.
Moreover, even if U.S. corn planted acreage increases 1 million acres next spring and the U.S. somehow manages to produce a corn yield equal to this year’s record of 178.4 bpa, the math still shows 2019/20 U.S. corn ending stocks decreasing marginally year-on-year (see page 2). That assumes 2019/20 U.S. corn demand of 14.880 billion bushels, down 100 million bushels from 2017/18.
Furthermore if the U.S. corn yield were to fall just 4 bpa below this year’s record yield (-2.2%), U.S. corn ending stocks would theoretically drop below 1.3 billion bushels, equating to a stocks-to-use ratio of only 8.7%. That would be less than the stocks-to-use ratio in 2013/14 of 9.2% which correlated at that time to December 2013 corn futures averaging just under $5.00 per bushel from March through the end of November that year.
The key in my opinion moving forward is for U.S. corn demand to stay strong. If total U.S. corn demand falls back to 2016/17-type levels of 14.65 billion bushels that lessens the price response necessary to insulate the 2019 U.S. corn acreage base, as well as, account for summer weather/yield volatility. The positive at the moment however is U.S. corn export demand remains very, very robust. And that’s important because I believe that’s the demand sector most likely to be cut over time if Brazil corn production rebounds in 2018/19 following a disappointing 2017/18 corn harvest. That said I don’t foresee Brazil being able to fix its supply deficit until Aug/Sep 2019 at the earliest (following Brazil’s safrinha corn harvest). Therefore U.S. corn exports should stay well supported into at least Q1/Q2 2019.
December Corn Futures Outlook
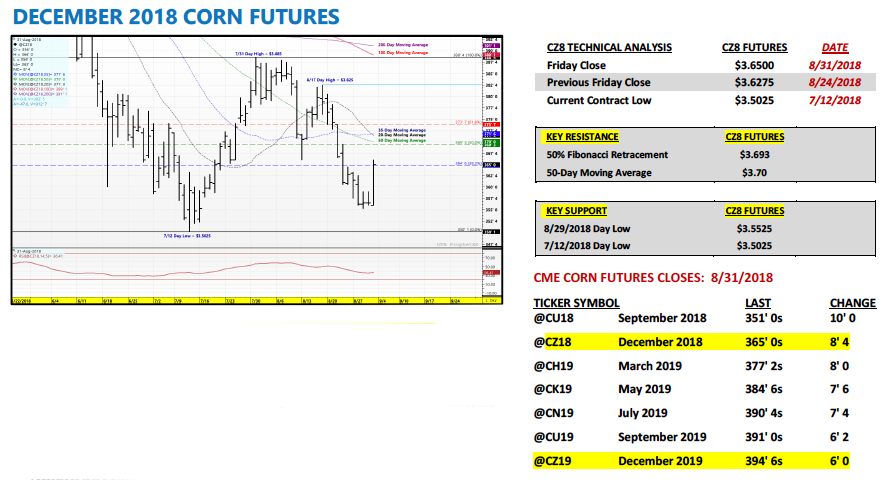
Corn futures continued to leak lower most of the week (until Friday’s 8 ½-cent higher close which I would attribute to Friday being First Notice Day for CU18); however the selling pressure was less intense than the previous two weeks. This begs the question, “At what point do Corn Bulls jump back in on the long side of the market?”That’s the question I’m being asked almost daily at the moment. My considerations for the preferred timing of possible re-ownership of corn futures are as follows:
- The last trading day for September 2018 corn futures is 9/14. Thereafter December 2018 corn futures will become the lead month. That said it’s not uncommon for the December contract to eventually seek the approximate level September corn futures went off the board at (eliminating the Sep/Dec spread). For example last year September 2017 corn futures closed at $3.41 ¾ on 9/14 with December corn futures closing at $3.54 ¼ (12 ½-cent spread to CZ). However just 3-trading sessions later, with CZ17 now the lead month, December corn futures traded down to a day low of $3.46 ½ on 9/19…less than a nickel from where September corn futures went off the board. Furthermore over time December corn futures traded even lower eventually dipping down to a day low of $3.35 ½ on 11/29. Point being…patience is often rewarded when choosing a re-entry point during Sep/Oct/Nov. Therefore giving yourself an opportunity to see what December futures do after September corn futures expire usually pays dividends.
- Fall rallies have been 12 ½ to 39 ¼-cents the past 3-years. In 2015 December corn futures rallied from a day low of $3.60 ½ on 9/4 back up to a day high of $3.99 ¾ on 10/7 (+39 ¼-cents). In 2016 December corn futures rallied from a day low of $3.25 on 9/30 back up to a day high of $3.59 ¼ on 10/20 (+34 ¼-cents). In 2017 December corn futures rallied from a day low of $3.45 ½ on 9/12 back up to a day high of $3.58 on 9/29 (+12 ½-cents). That said clearly 35-cent up moves in the fall are possible; however the entry point is extremely critical. If you misjudge the entry point by 20 to 25-cents (too high), you’ll be forced to sit through
Sep/Oct/Nov probably trying to break-even. The last 3-years offered December corn futures lows in Sep/Oct/Nov (after Sep Futures expiration) of $3.35 ½ in 2017, $3.25 in 2016, and $3.56 in 2015. Therefore those prices should provide some indication as to what Dec futures levels you should consider starting to scale back into the market at on the long side. Also of note the current contract low in CZ2018 is $3.50 ¼ from 7/12.
I will say…this is a year where I definitely want to re-own December or March corn futures on additional price weakness this Sep/Oct/Nov. HOWEVER, I want to protect myself from getting in too soon (preferable between 9/14 and 9/28).
Twitter: @MarcusLudtke
Author hedges corn futures and may have a position at the time of publication. Any opinions expressed herein are solely those of the author, and do not in any way represent the views or opinions of any other person or entity.
Data References:
- USDA United States Department of Ag
- EIA Energy Information Association
- NASS National Agricultural Statistics Service
 Ready To Break Out?")


")
 Rolling Over At Key Fibonacci Level?")
