March corn futures drifted lower this week, closing down 9 ½-cents per bushel week-on-week, finishing on Friday (12/23) at $3.46 ¾. Corn specific market / news headlines remain relatively non-eventful, which isn’t atypical for last half December.
Therefore I thought it would be good research project to look into corn futures holiday price seasonality over the upcoming holiday week.
Corn Futures Holiday Price Seasonality
It seems like every December we have a conversation regarding what corn futures will do during the last week of the month considering it’s often filled with early closes at the CME and low volume trading sessions with traders taking extended vacations from Christmas to New Year’s. It also obviously includes the last trading day of the calendar year. Therefore all of this can at times lead to the type of market environment where a relatively small amount of volume can distort the price of corn (or any commodity) for a short period of time. That said, “Is there a discernible pricing pattern in March corn futures over the Christmas to New Year’s Holiday week?”
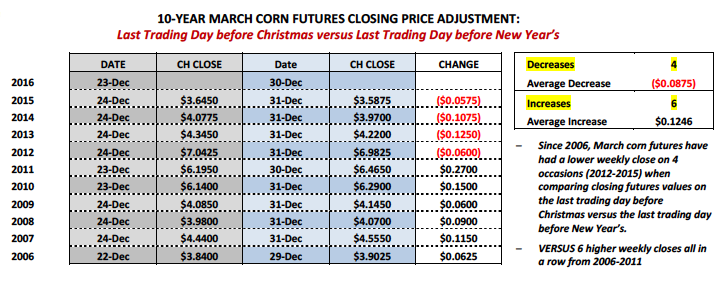
Over the last 10-years, if we compare the March corn futures close on the last trading day prior to Christmas (usually 12/24) versus the close on the last trading day prior to New Year’s (usually 12/31), March corn has closed lower on 4 occasions versus 6 increases. The average futures price decrease has been 8 ¾-cents per bushel versus the average increase of 12 ½-cents per bushel. The extremes on both ends were a 12 ½-cents per bushel decrease from 12/24 through 12/31 in 2013 compared to a 27-cents per bushel increase from 12/23 through 12/30 in 2011.
HOWEVER, the most interesting takeaway…the 4 decreases all came in consecutive years that being the past 4-years 2012 – 2015. Therefore the 6 increases also came in consecutive years from 2006 – 2011.
Weekly Corn Market Highlights:
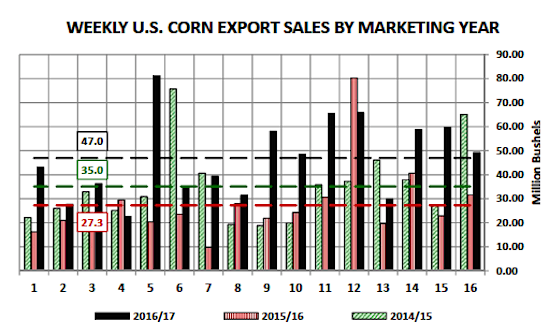
- S. corn export sales totaled 49.2 million bushels for the week ending December 15th, 2016. Year-to-date sales for the 2016/17-marketing year increased to 1,352.1 million bushels versus 767.5 million in 2015/16. Therefore U.S corn export sales continue to run approximately 76% ahead of a year ago. I’m still expecting that gap to narrow over time based on what appears to be excellent corn production prospects for both Argentina and Brazil. In fact on Monday (12/19), private crop consultant AgRural reportedly estimated Brazil’s 2016/17 corn production at 88.3 MMT versus the USDA’s December forecast of 86.5 MMT and 67 MMT in 2015/16. They also forecasted safrinha corn production of 59.5 MMT versus just 40.7 MMT in 2015/16. Therefore, until the market senses a legitimate weather threat potentially reducing Brazil’s corn crop, traders will more than likely assume the current window of aggressive weekly U.S. corn sales and inspections is slowly closing. It’s also worth noting that the USDA is projecting combined 2016/17 corn exports from Argentina and Brazil of 53 MMT, which is nearly equal to the U.S. forecast of 56.5 MMT. Point being…Brazil and Argentina are major forces in the world corn export market.
- The Dollar Index made new 2016 highs again this week, trading up to a day high of 103.65 on Tuesday (10/20), its highest level since 12/31/2002. Dollar appreciation continues to weigh on U.S. commodity values. That said I don’t see Dollar strength necessarily pushing corn futures below current underlying price support ($3.35 to $3.40 in March 2017 corn futures); but rather acting as another key resistance factor on rallies back to the upper-end of the current trading range.
- Both corn and ethanol advocates continue to discuss President-Elect Donald Trump’s nominees for key Cabinet positions concerning the environment and energy. Scott Pruitt (nominated to head the EPA), Rex Tillerson (nominated for Secretary of State; CEO of ExxonMobil) and Rick Perry (nominated for Energy Secretary) all presumably have one thing in common, their love for Big Oil, and specifically as far as Pruitt is concerned, a documented disdain for green-energy. Suffice it to say I’m going assume that none of these individuals will be receiving a Christmas card from the likes of the Renewable Fuels Association, the American Coalition for Ethanol, or Growth Energy. For corn growers any negative, downward adjustment to the Renewable Fuel Standard (which provides a backstop for a guaranteed minimum level of renewables including conventional biofuels) would be a tremendous blow to corn-ethanol demand, which currently equals 5,300 million bushels for 2016/17 or 36.3% of total U.S. Corn Demand. Trump’s insisted that ethanol advocates need not worry…however history has shown that the probability of campaign promises being fulfilled is just slightly lower than the number of Super Bowls the Minnesota Vikings have won.
Key Price Considerations For March Corn Futures
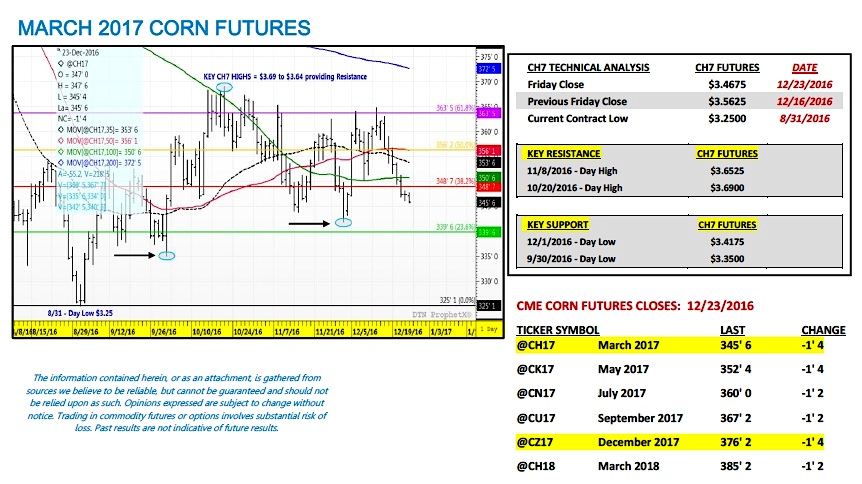
March corn futures (CH7) closed on Friday (12/23) at $3.46 ¾ finishing down 9 ½-cents per bushel week-on-week.
Some key takeaways from this week’s price action:
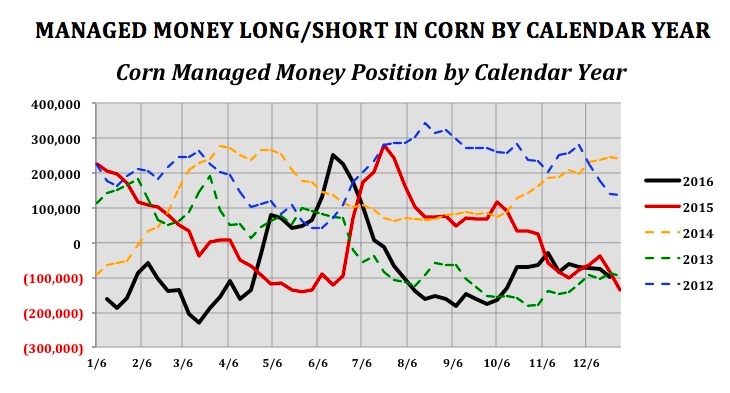
- Friday’s Commitment of Traders report showed the Managed Money net corn short growing to -97,086 contracts as of the market close on December 20th, 2016 versus -74,007 contracts the previous week. Clearly this played a key role in corn futures continued downward slide. It’s worth noting that under a similar U.S. and World corn fundamental backdrop a year ago Money Managers continued to increase their net corn short into the second week of January. On January 12th, 2016 the Managed Money net corn short was reported at -186,831 contracts. I would not be surprised if Money Managers took the same approach early in 2017. As a price point of reference, the March corn futures day low for the month of January in 2016 was $3.48 ½ on 1/7. Therefore March 2017 corn futures are already trading below that level.
- The technical price action in March 2017 corn futures (+CH7) is clearly negative. March corn closed below both the 35-day and 100-day moving averages this week. The 100-day in particular had been a key line of support ($3.506). The next levels of support are the day lows of $3.41 ¾ on 12/1 followed by $3.35 on 9/30. If March corn manages a close below $3.35, the current contract low of $3.25 from 8/31 would then be in play.
Despite the recent negative price action I’m unwilling to get Bearish at what I believe to be the lower-end of the current trade range ($3.41 to $3.35 in March corn futures). Corn futures are approaching downside price levels where traders will be sizing up the risk versus reward of adding additional corn shorts. With the current March contract low now within shouting distance and plenty of South American weather still yet to play out, I’m actually looking for ways to own corn if and when March futures break another dime.
Twitter: @MarcusLudtke
Author hedges corn futures and may have a position at the time of publication. Any opinions expressed herein are solely those of the author, and do not in any way represent the views or opinions of any other person or entity.
Data References:
- USDA United States Department of Ag
- EIA Energy Information Association
- NASS National Agricultural Statistics Service

 Flirting With Critical Support… Again")


