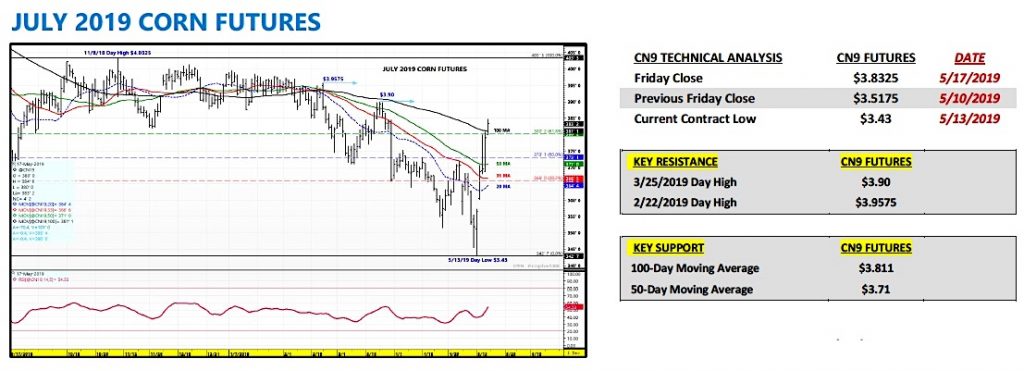
July corn futures closed up 31 ½-cents per bushel week-on-week, finishing at $3.83 ¼ last week.
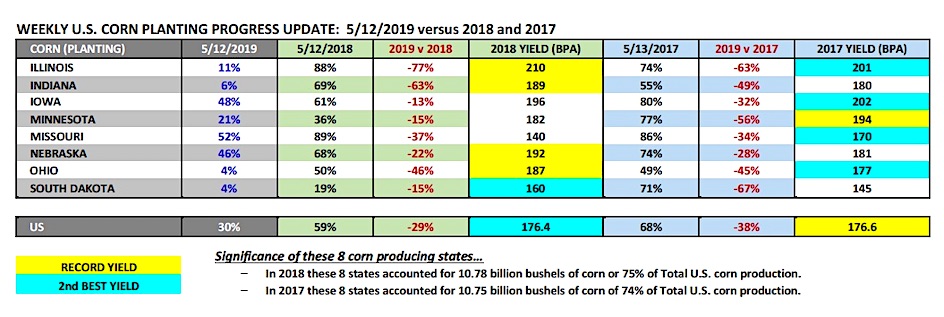
Monday’s Weekly Crop Progress report showed U.S. corn planting at just 30% complete as of May 12th versus 59% last year and the 5-year average of 66%.
Severe planting delays were noted once again in the Eastern Corn Belt with Illinois just 11% planted versus 88% in 2018, Indiana 6% planted versus 69% in 2018, and Ohio 4% planted versus 50% in 2018.
Last year all 3 states contributed significantly to the U.S. achieving a 176 bpa national corn yield with Illinois registering a record state corn yield of 210 bpa, Indiana a record state corn yield of 189 bpa, and Ohio a record state corn yield of 187 bpa.
Clearly all 3 states are off to a much more challenging start to the 2019 growing season, and with more rain identified in both 6 to 10-day and 8 to 14-day forecasts for virtually the entire Midwest, I don’t see the pattern shift necessary to make up for persisting, large-scale planting delays.
Also of note, if we go back to the USDA’s 2019 March Prospective Plantings forecast for corn of 92.792 million corn acres, an increase of 3.66 million versus 2018, approximately 44% of that expected acreage expansion was planned for North and South Dakota (+1.6 million acres).
In Monday’s report North Dakota was just 11% planted versus 31% in 2018 and the 5-year average 43%. South Dakota was 4% planted versus 19% in 2018 and the 5-year average of 54%. At some point, the market will really start to question whether or not those additional corn acres will ever get seeded. Again current weather models strongly indicate the continuation of existing planting delays.
On Tuesday Informa Economics issued its revised 2019 U.S. corn planted acreage forecast of 90.692 million acres, down 2.1 million from the USDA’s March figure. Other reputable analysts offered even more aggressive acreage declines with some pointing to U.S. corn acreage eventually falling below 90 million; while also anticipating 5 to 6 million acres of prevent plant this spring.
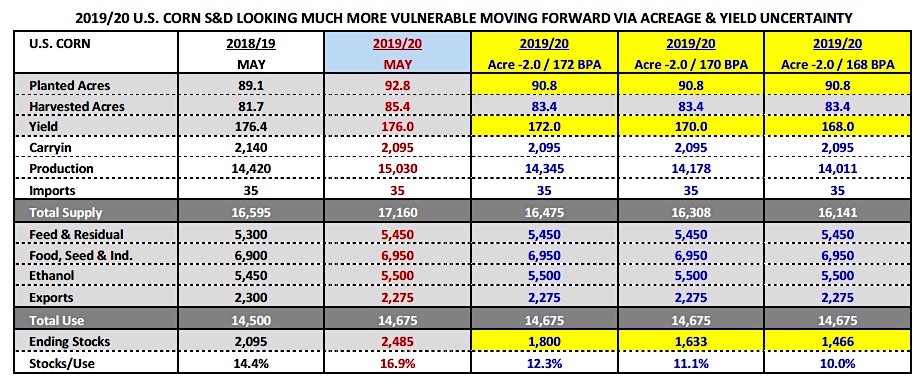
How much would a potential 2.0 million planted corn acreage decline affect the 2019/20 U.S. corn balance sheet?
Assuming the USDA leaves the yield unchanged at 176 bpa in the June WASDE report, total production would drop approximately 350 million bushels. However where it really starts to get interesting for Corn Bulls is that there are already those suggesting the U.S. will be fortunate to achieve a final 2019/20 U.S. corn yield ranging from 172 to 170 bpa this year due to corn being planted late and past the optimum planting dates to achieve maximum yield results.
That said the quick math on a 2.0 million planted corn acreage decline coupled with a 172 bpa yield equates to total production dropping 685 million bushels. 2019/20 U.S. corn ending stocks would decrease to 1.800 billion bushels versus the USDA’s current forecast of 2.485 billion bushels.
Now for the disclaimer…those same analysts remain quick to point out that summer weather still plays the ultimate role in determining final corn yields. Even so, I think it’s worth mentioning one has to look no further than a year ago to see the advantage states such as IL, IN, OH, and NE all gained from a strong early planting pace, which eventually led to record state corn yields in all 4 of those states in 2018.
Additionally if we go back and include 2017 (see below), Illinois, Indiana, Iowa, Minnesota, Missouri, Nebraska, Ohio, and South Dakota all achieved either their current record state corn yield or their 2ndbest state corn yield in 2017 or 2018. The U.S. also recorded its top two corn yields in 2017 and 2018. One of the common denominators…in 2018 58% of the national crop was planted as of the 2nd week of May. In 2017, 68% of the national corn crop was planted as of the 2nd week of May.
Point being… planting dates apparently do matter regarding yield potential and this isn’t your typical “slow” planting start that can easily be dismissed.
U.S. Corn Futures Trading Price Outlook
I’ve spent the majority of this commentary talking about why corn has and should continue to rally; however conversely, I think it’s important to ask, “What could stop or potentially slow this supply-side up move in corn?”
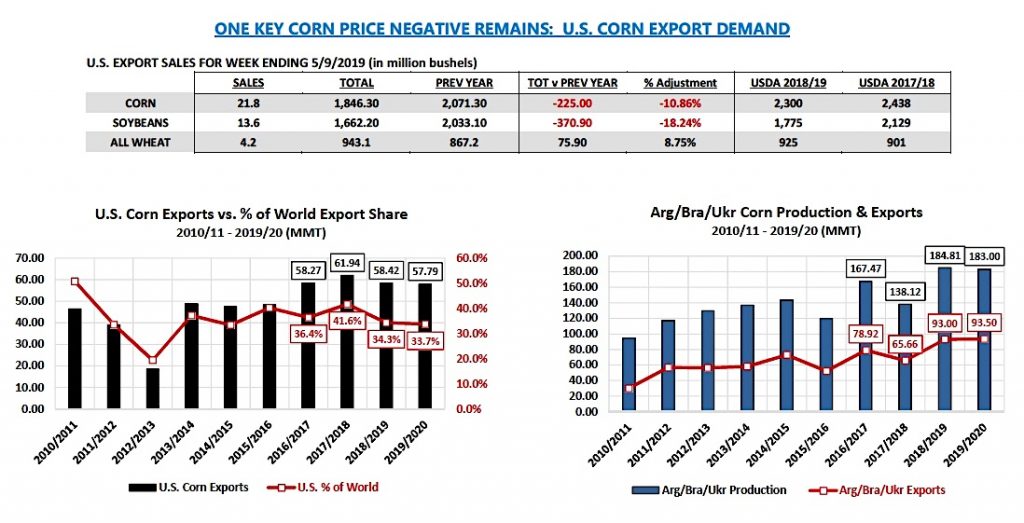
Sluggish U.S. Corn Export Demand– U.S. corn export sales continue to run approximately 11% behind 2017/18, which projects to 2018/19 U.S. corn exports of 2.170 billion bushels.
In the USDA’s May 2019 WASDE report the USDA estimated 2018/19 U.S. corn exports at 2.300 billion bushels. Therefore it’s entirely possible the USDA could still lower its 2018/19 U.S. corn export forecast in proceeding Crop reports by 50 to 100 million bushels. This would likely push 2018/19 U.S. corn ending stocks (and 2019/20 U.S. corn carryin stocks) over 2.500 billion bushels. Needless-to-say these stocks will act as a huge supply buffer to 2019/20 U.S. corn production, offsetting to a degree this year’s expected corn acreage decline, as well as, some minor downward tweaks to the 2019/20 U.S. corn yield (estimated at 176 bpa in the May 2019 WASDE report). Keep in mind record combined corn exports from Brazil, Argentina, and Ukraine are expected for 2018/19.
Corn vs. Soybeans Acreage Switching– Based on the price action in soybeans and corn on Friday (5/17), it’s become apparent that traders are buying corn and selling soybeans versus buying corn outright.
The assumption is that any corn acres lost will simply go to soybeans, which means that 2019/20 U.S. soybean ending stocks are likely headed north of 1.000 billion bushels via added soybean acres. The new-crop soybean (SX19) / corn (CZ19) ratio narrowed to 2.13 on Friday. That’s the tightest that price ratio has traded in over 2-years, which means the market is clearly encouraging farmers to plant corn over soybeans. However…it’s doing it primarily by discounting the price of November soybeans to unprofitable levels. Just 3 weeks ago that ratio was 2.37. Point being…weakness in soybeans is limiting the topside market reaction in corn. I expect this to continue.
Technically, July corn futures came off its highs late in Friday session with Corn Bears conceding nothing going into a major weather weekend. Soybeans sold off to new lows as well in the last 5 minutes of the session holding corn down.
Monday, assuming the rains come as expected this weekend, I expect corn to move higher with $3.90 to $3.95 in play sometime next week.
Twitter: @MarcusLudtke
Author hedges corn futures and may have a position at the time of publication. Any opinions expressed herein are solely those of the author, and do not in any way represent the views or opinions of any other person or entity.


