Weak earnings and even worse conference calls drove United Parcel Services (UPS) and First Republic Bank (FRC) down right from the open, then even lower as the day unfolded.
Between these stocks, two of market’s primary fears came to the forefront – a weakening consumer and problems in the banking system.
Further confirming that the market would not recover from these fears and a lower open was the price action in the TLT, which gapped higher and continued higher. TLT is still where risk-off equity money runs to hide and wait.
Lower interest rates, fear, and lower stocks gave GLD reasons to rally out of a reversal pattern. After testing the 184 level and breaking out of an inside day pattern, it’s set up for a potential run higher IF it can close over its nearby 10 DMA and then continue higher. Gold bulls should keep an eye on it.
UPS is the obvious reason that IYT was the biggest loser in the sector summary table today, and if you’ve been reading this Daily over the last couple of days, then the second biggest loser, discussed below, won’t surprise you.
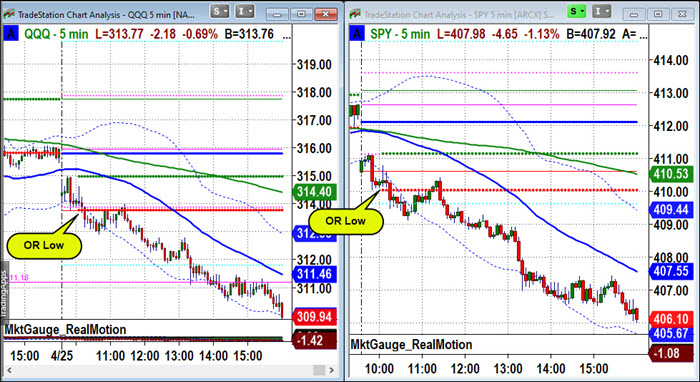
Additionally, the intraday patterns we’ve been discussing based on the Opening Range did their job today by highlighting that it was not a good day to try to buy the lower open and instead, it would be a trend day lower.
The second biggest losing sector was, as we’ve been following, SMH. Today’s anticipated breakdown puts SMH well below its 50 DMA, while the SPY and QQQ are still above their 50 DMAs. Until it gets back over its 50 DMA or develops a bullish reversal pattern, this should be avoided.
Every sector was down today, so there are likely to be more trend-down days in the near term. Today was a good example of how to recognize and avoid them.
Below you’ll see the intraday charts of the SPY and QQQ with the Opening Range levels marked by the red and green horizontal lines.

Today was a good example of an OR breakdown in the SPY that attempts to reverse, but it was not confirmed by the QQQ.
After the failure of the QQQ to trade back over its OR low, the retracements to the OR low pattern in both the SPY and QQQ became confirmed bearish trend continuation patterns, and the trend down day resumed with a vengeance.
This is the busiest period of earnings season, so every day has the potential to be filled with surprises. Keep an open mind and a disciplined approach to your trading.
Stock Market ETFs Trading Analysis & Summary:
S&P 500 (SPY) The new range to watch is 405 – 410 on a closing basis
Russell 2000 (IWM) 170 support – 180 resistance
Dow Jones Industrials (DIA) Over the 23-month MA 333-support to hold
Nasdaq (QQQ) 306 support over 320 better
Regional banks (KRE) 44 now pivotal resistance
Semiconductors (SMH) 245 resistance with support at 235
Transportation (IYT) Still under the 23-month MA with 224 resistance 215 is Real Motion support
Biotechnology (IBB) 130 major pivotal area-135 resistance
Retail (XRT) 58- 64 trading range to break one way or another
Twitter: @marketminute
The author may have a position in mentioned securities at the time of publication. Any opinions expressed herein are solely those of the author and do not represent the views or opinions of any other person or entity.


