We can all agree that the markets are in constant ebb and flow, never moving in a straight line, always undulating. So how then, do we make sense of the market moves to capitalize and get in prior to them taking off?
By understanding the basics of market structure.
We start with the basics of what makes up a trend:
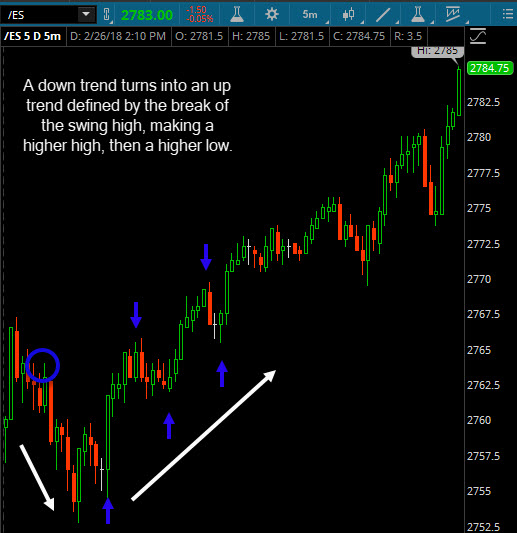
- Up trend – higher highs, higher lows
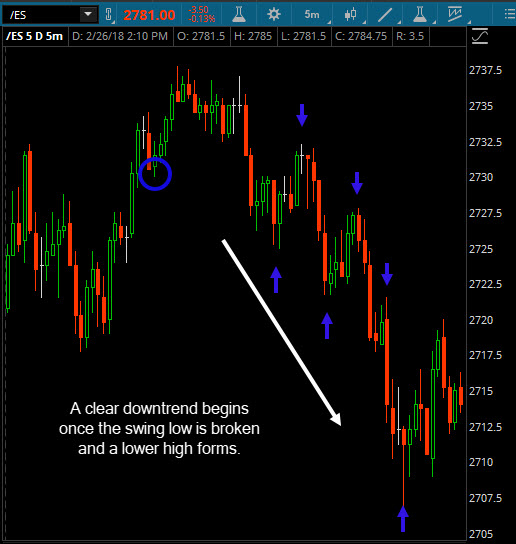
- Down trend – lower highs, lower lows
That’s great, but the market is “in trend” only half the time, the other half it’s moving sideways. So we have to be able to identify other forms of market structure for enhanced trading results.
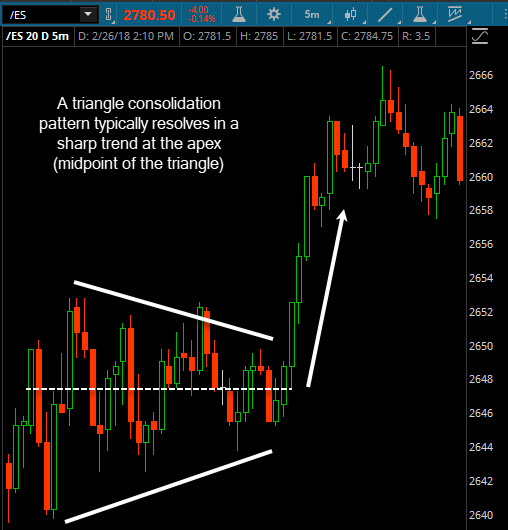
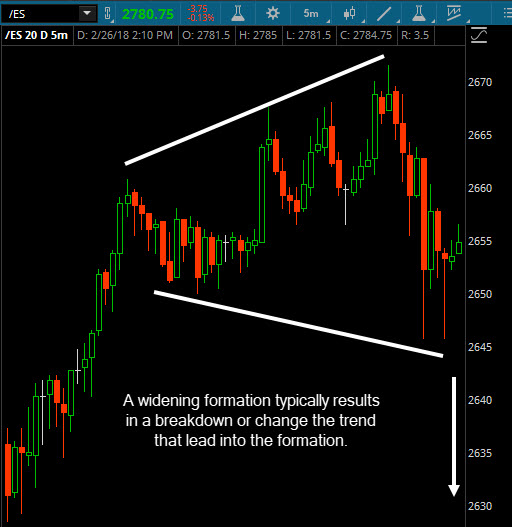
A sideways or consolidating market is made up of either lower highs & higher lows (a triangle formation) or higher highs, and lower lows (a widening formation).
Market Structure Identification: Triangle Formation
Market Structure Identification: Widening Formation
So when we look at a chart, it’s important to first define the trend (or lack thereof). We do that, by looking at the highs and lows in relation to one another.
Once we identify the trend, we can better determine where the market is likely to continue or change that trend and that is preciously where we want to look at placing trades.
More on how to place those trades in part 2.
Thanks for reading.
Twitter: @EminiMind
Any opinions expressed herein are solely those of the author, and do not in any way represent the views or opinions of any other person or entity.


