For the past 10 years, dip-buying weakness as the market has only been under pressure for short periods has worked out very well.
However, the economy and world are in a new situation that involves geopolitical stress, rising inflation along with the continued recovery from the pandemic.
With that said, dip-buying weakness could get much tougher if the market gets stuck within ranges or trends lower for a long period.
Therefore, if traders are going to look for reversal plays, they should at least stick to an easy-to-use reversal setup.
Searching for a short-term bottom is no easy task and can be very costly if the position is held and the dip keeps dipping. In that case, we’d be buying a falling knife.
One simple way to increase your chances of a reversal trade is by waiting for a second day to confirm a reversal move. While this can be done on any timeframe, we will be using a daily chart.
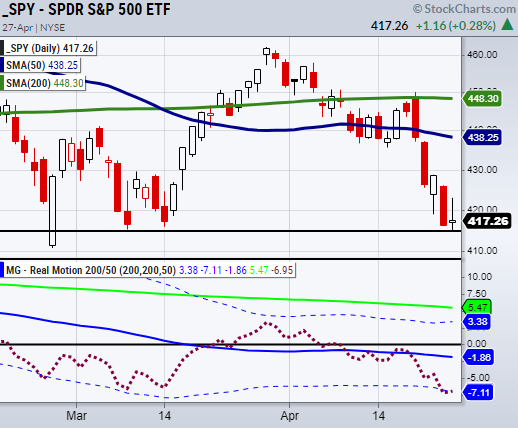
Using the S&P 500 (SPY) as an example, we can look at its recent move to support near $414 as a potential dip-buying opportunity.
Next, we can watch for the SPY to clear its Wednesday high over $422.92.
If on Thursday, the SPY clears and holds this level we would have an entry based on a reversal with our risk underneath a key support level that also has technical support on the chart.
Of course, the downside to waiting is getting in a trade at a higher price.
However, the extra money paid is well worth it since it increases the chance the trade will work out.
Whether the trade works is for the stock market to decide, however, at least we know we used a sound method for entering a trade with sound risk parameters.
It is good to remember that sometimes you will take great-looking trades that don’t end up working out.
One last thing to note is when looking at the SPY from our Real Motion Momentum indicator at the bottom of the chart, we can see that momentum (red dotted line) could potentially bounce off the lower band showing momentum is holding a key level.
Watch Mish’s latest appearance on Fox Business!
Stock Market ETFS Trading Analysis:
S&P 500 (SPY) 414 to hold. 410 support.
Russell 2000 (IWM) 187 Pivotal.
Dow (DIA) 326 next support area.
Nasdaq (QQQ) 317 pivotal.
KRE (Regional Banks) 63.80 now minor resistance level.
SMH (Semiconductors) 237 new resistance. Needs to find support.
IYT (Transportation) 239 support.
IBB (Biotechnology) 118 support.
XRT (Retail) More support at 70.
Twitter: @marketminute
The author may have a position in mentioned securities at the time of publication. Any opinions expressed herein are solely those of the author and do not represent the views or opinions of any other person or entity.


