Last Wednesday, if you somehow had a premonition that the Consumer Price Index (CPI) was NOT going to show signs of cooling but instead surprise to the upside to bring core CPI to its highest annual pace in four decades, you would have expected markets to tumble on Thursday.
And you would have been right until about 11 a.m., when markets didn’t just get back to breakeven, but went on to post strong gains. The S&P 500 intraday range from the lows in the morning to the highs at the close was about 5%.
The biggest angst for the markets this year has surely been the path and stickiness of inflation, so it befuddles the mind to make sense of Thursday’s market reaction, even with Friday giving back some of the gains.
Was it the yeomen work of economists and analysts, pouring through the details of the CPI data to uncover a good news story? It sure doesn’t look like it. We wouldn’t call the inflation report terrible, but it certainly was not good. There were some signs of prices falling in several goods categories—but used car prices rose, defying the trend in wholesale prices that typically leads this category. Airline prices, which had been falling, turned back up a bit. Shelter prices rose, although we are unsure if this category will elicit a market response, given it follows home prices with a multi-quarter lag—since home prices are rolling over, this should follow at some point. Services inflation was high as wages are coming through. Overall, it was not a good CPI report, so why such a happy market on the data release day?
We’ll let you in on a secret—nobody really knows why the market moves up or down on a given day. Sure, we or anyone else who opines on the market can slap a narrative on it that sounds logical, plausible … even convincing. But the truth is, the market is composed of millions of participants with different characteristics, different reaction functions to various news or data and different risk appetites. And some of these millions of participants meet at a price that one is willing to sell, and the other buy a given security. Oh, and the mood of those participants changes from day to day. For instance, there is a small relationship between the S&P daily performance and the weather in New York. (Okay, just checked the Weather Network and this week looks like a sunny one, which is good news.)
Day-to-day market moves are random at the best of times and when the market is in the tenth month of a bear, those random moves are magnified substantially. The VIX index, which measures the implied volatility in S&P 500 index options, remains tame compared with past periods of market stress, with many waiting for a reading above 40 as some potential sign of capitulation (like that can be measured). However, there is no denying the uncertainty in this market.
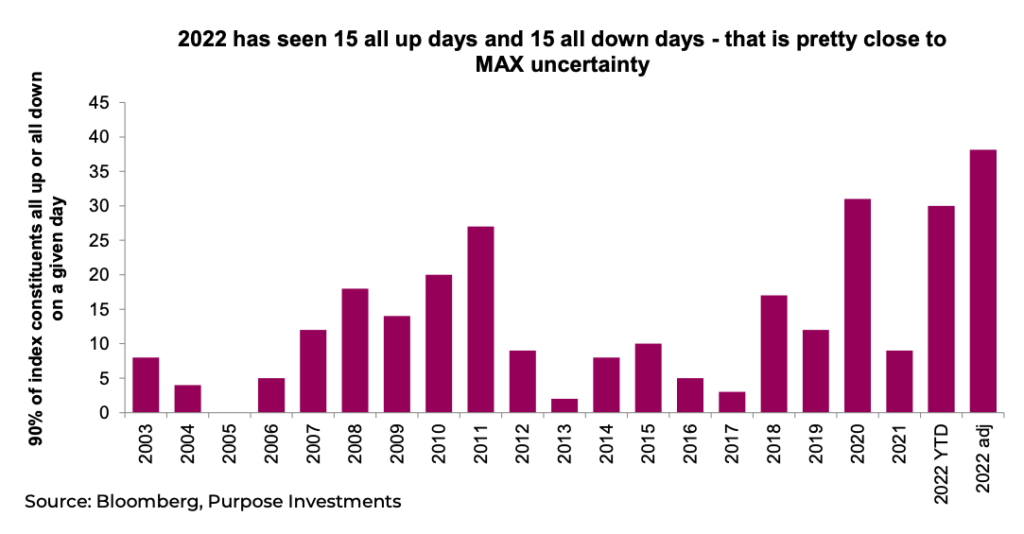
One metric we have used over the years is measuring the number of all up or all down days for the S&P 500. An up day is when 90% of the index members rise on a given day; conversely a down day is when 90% fall. This year, there have been 30 such trading days, all up or all down. This is on pace to be the most all or none days in at least 20 years. Also worth noting, ten of those 30 days have occurred in the last month alone. The market appears to be at max uncertainty, which could be good … or bad.
Here’s what we know
Let’s look past the daily gyrations in the market for a moment to gain some perspective. This is what we know, and if we know it, so does the market:
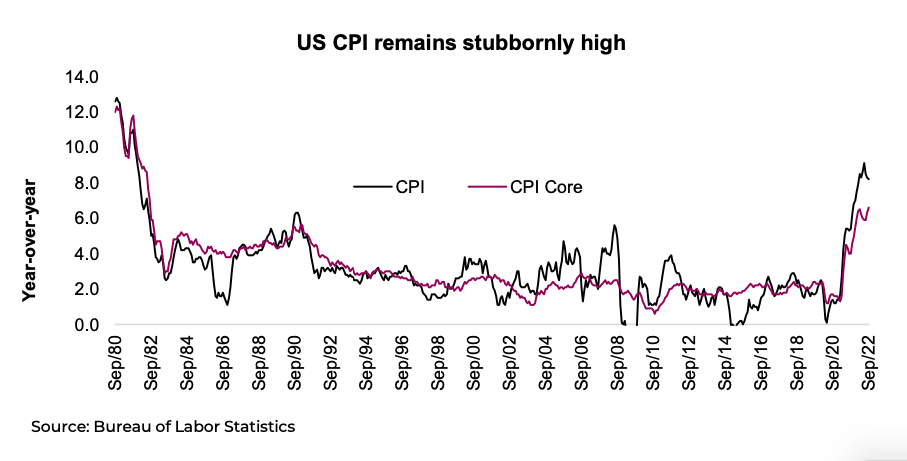
- Inflation, not surprisingly, is proving to be stickier and has so far shown little signs of coming back down from elevated levels. That being said, most forward-looking indicators that warned of rising inflation to current levels are showing signs of either rolling over or less inflation ahead. Remember, inflation is slow to react so this may lead to more waiting than the market is comfortable with.
- Recession risk is high and rising. China’s growth has slowed, Europe may already be in a recession due to energy and slowing global trade. The Canadian economy is doing well but starting to slow. The U.S. economy is doing better than most but is also starting to show signs of slowing. A recession, which is bad, would also alleviate inflation pressures, which is good. Would the good be a bigger positive for markets than the bad? Depends on the recession or how much global growth slows. One good aspect is that various economies are already at different stages of slowing; a much better backdrop than 2008 when all economies slowed simultaneously. By the time slowing growth potentially takes hold in North America, other economies may already be on the mend. This desynchronized slowing is kind of a good thing.
Earnings estimates are too high, or so says just about everybody. This is widely known and at least partially priced in. The S&P 500 has seen its forward price-to-earnings multiple drop from 21x to 15x. The TSX is trading at a paltry 11x, Europe 10x, and Emerging Markets 10x. These valuations, roughly at the lows of 2020, certainly incorporate potential softness in earnings.
Markets have priced in all or much of this news, even if it does sound all doom and gloom. 10-year bond yields in the U.S. have risen from 0.75% to 4.00%. Futures are pricing in a peak Fed Funds rate of 4.9% in Q1 of 2023, nearly another 175bps of hikes. The S&P 500 is down -25%, TSX -17%, Europe -23% (-28% in CAD), Japan down -9% (-23% in CAD), and Emerging Markets -34% (-27% in CAD).
These are all ‘known knowns’ and shouldn’t elicit too much fear about the future. It’s surprises, either good or bad, that will move markets going forward. Could already sticky inflation prove even stickier than the market expects? Yes, but it could also start to roll over. Either way, markets will move either down or up, respectively. A mild global recession would likely not be bad for markets, but if more severe, it would be, and if milder, it would be a positive surprise. Earnings estimates could fall but companies have been benefitting from inflation as there are positive surprises too.
Impact on portfolios
We would agree the path forward is very uncertain, with the magnitude of daily gyrations clearly supporting this view. We don’t know when the bear will bottom: history and experience tell us bears always feel like they last a long time (time flies during bulls and drags during bears). Maybe it will be when inflation, the root cause of this bear, begins to improve. Or maybe it will just end, and a month afterwards a narrative will gain traction to explain why it ended when it did.
We know lower prices for equities and bonds means we are closer to the bottom, and future risk declines. A good way to think about it is the S&P 500 at 4,800 in January was much riskier than at 3,600 today. We remain neutral with our equity allocation—it doesn’t feel right to add just yet on the hope the surprises turn positive, but equally it doesn’t feel right piling into cash.The daily gyrations of this magnitude are often seen at key turning points, in either direction. Let’s hope the weather forecast remains sunny for NY – any little bit will help.
Source: Charts are sourced to Bloomberg L.P., Purpose Investments Inc., and Richardson Wealth unless otherwise noted.
Twitter: @ConnectedWealth
Any opinions expressed herein are solely those of the authors, and do not in any way represent the views or opinions of any other person or entity.


