How do stocks react when the Fed begins to tighten rates? How do they react when markets begin to anticipate the inception of a new tightening monetary policy regime?
For years the FOMC has maintained a Zero Interest Rate Policy (ZIRP), effectively relegating these questions to academic interest only, rendering them moot for investors and traders allocating capital and managing risk in an environment awash in dirt-cheap liquidity.
A quick glance at recent movements (or lack thereof) of the 30-Day Fed Funds Futures (ZQ) contract would suggest nothing about this has changed. But behind it’s flatlined appearance, ZQ does trade; and how it has traded since the Fed began to make reference to Tapering last Summer suggests questions of the relationship between stocks and tightening rates are becoming relevant once again.
Anyone familiar with the relationship between equities and the short-end of the yield curve (i.e. out of 2-Year US Treasury Notes) knows that expectation/implementation of a tightening policy environment tends to strangle bull market advances: slowly, and then all at once stock market corrections unfold. This poses a question we haven’t seriously entertained in over half a decade but promises to be crucial for stocks in 2014-2015:
Given a Fed policy backdrop finally engaged in “soft tightening” (a phrase that helps me evade a lengthy tangent into the “taper v. tightening” debate), is the 5.5 year cyclical bull market under threat?
Below is a weekly chart of S&P 500 E-mini Futures (ES) overlaid with 30-Day Fed Funds Futures (ZQ) and their 1-year (50-week) correlation plotted beneath. Since 1999, the correlation coefficient between these contracts has swung between shorter periods where they traded in tandem (>0.00) and sustained periods in which they traded inversely (<0.00). In total, five positive-to-negative oscillations occurred between 1999-2012. Now, with the correlation aggressively breaking down through 0, a sixth is formally underway. Whenever this has happened, stocks have corrected: sometimes modestly, sometimes violently; sometimes after an extended period where the bullish advance underway continues, and sometimes immediately.
S&P 500 E-mini Futures (ES) v. 30-Day Fed Funds Futures (ZQ): 1999-2014 (click image to zoom)
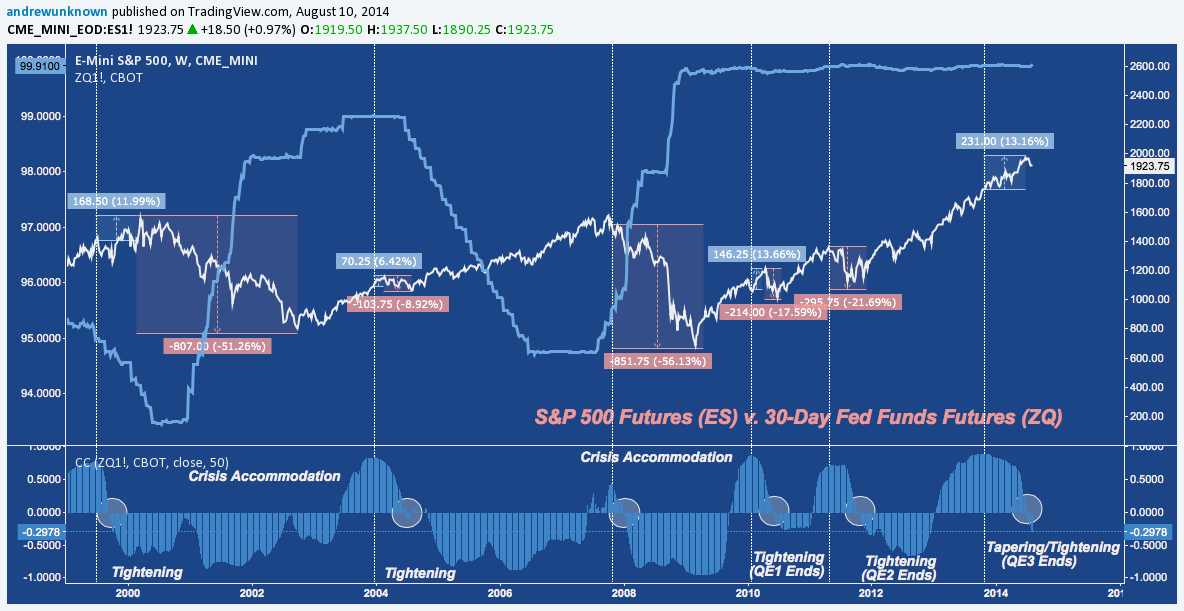
What can we learn from the five previous oscillations where the ES:ZQ correlation crosses from positive to negative? What should we expect stocks to do from here?
Here are a few preliminary observations on the five periods between 1999-2012
- All five occurrences feature a 1-year correlation that peaks above +0.45, with 4-of-5 tagging 0.7 or higher before rolling over.
- Three of five occurrences (1999, 2004, 2010) feature a period in which ES continued to advance for a multi-week period before correcting.
- In contrast, in two of five occurrences (2007, 2011) ES immediately topped.
- Except for late 2007, each correlation peak was a single rounded top. 2007′s two small peaks mark out the double top there.
- Four of five occurrences developed in response to active (1999, 2004) or anticipated (2010, 2011) changes in monetary policy.
Let’s break the chart above down further to understand it’s time and price implications. For the following statistics, assume a short in ES is opened at each historic correlation peak.
How far did ES advance after the correlation topped before it rolled over? Put another way: what was the average adverse excursion – if any – and how long did it last?
- Average adverse excursion: -10.69%
- Average duration: 138 days
What was average ES sell off under which a short would profit? How long did those last?
- Average decline: -31.11% (Mean: -21.69%)
- Average duration, peak-to-trough: 351 days (Median: 161 days)
So how about the current market?
The most recent correlation peak (>0.9) occurred in mid-2013 (just following the introduction of the Taper theme into FED policy discourse). The advance in ES since marks the longest adverse excursion of all six occurrences studied here, and measures second only to 2010’s -13.66% distance from correlation to market peak:
- Current adverse excursion: -13.16%
- Current excursion duration: 266 days.
Since the sixth and latest correlation peak is followed by an adverse excursion, what’s the average decline after the excursion ends?
- Average decline following adverse exncursion: -25.92% (Mean: -17.59%)
Fair Enough. But How Are Fed Funds Traders Actually Positioned?
Glad you asked. Given this historic relationship and performance, one might expect traders to be firmly set up in bearish positions on expectation of further policy tightening. But is that the case? Fortunately, the CFTC’s Commitment of Traders (COT) report provides us with weekly updates on how ZQ traders are positioned separately and in aggregate.
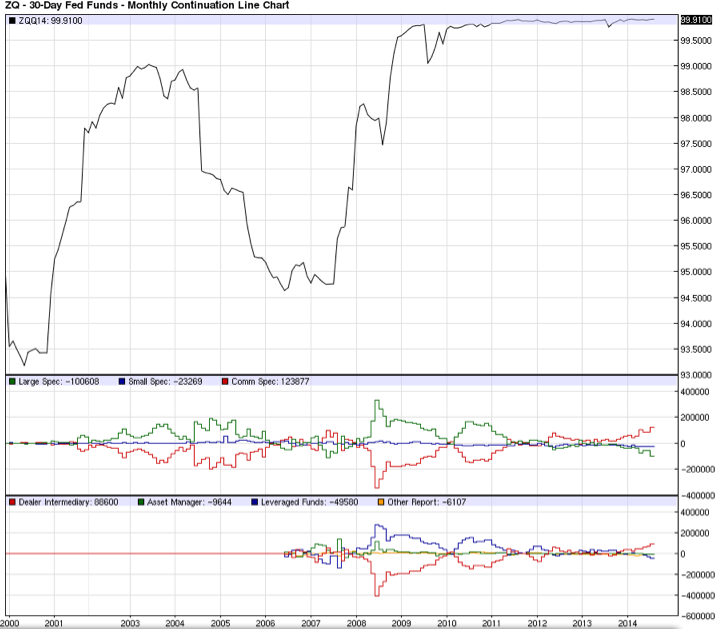
As I mentioned earlier, ZQ‘s flatlined facade hides a lot of important activity going on underneath. Below you’ll see ZQ again (just like above), with two COT studies beneath: 1) data pulled from the broad (“legacy”) COT Report, and 2) the Traders in Financial Futures (TFF) Report (which began in 2006), a disaggregated version of the first study which provides more insight into how different parties are positioned.
30-Day Fed Funds Futures: Commitment of Traders (click image to zoom)
A few takeaways from this COT data:
- Commercial Speculators are record long ZQ futures. In general, Comm Specs are parties whose explicit goal in futures markets is to establish and maintain hedges beneficial to some business. For this reason, Comm Specs build positions against the prevailing trend which are unwound and reversed after the trend changes. Since mid-2013 Comm Specs have redoubled their interest in taking long ZQ positions. This may seem out of character with a glance at this line chart; but recall the breakdown in he ES:ZQ correlation over this period – as ES has continued to trade higher, ZQ is trading lower. Comm Specs are aggressively positioned for this to continue.
- Conversely, Non-Commercial Speculators and Small Speculators (Non-Reportables) – those who are in it for the money – are as short as they’ve been in years. At -100k net, Non-Comm Specs (large funds) are nearing May 2007’s record net short positioning. Small Speculators continue to exceed the levels seen in Spring 2010, 2011 and 2012 with multiple months of -20k in their highest conviction sustained short positioning ever.
- The TFF breaks this down further. on the Commercial side, Dealer Intermediaries – sell-side, hedging entities that strive to keep an even book – are longer than ever. Meanwhile, Non-Commercials are picking up the other side of this trade with Leveraged Funds record short.
Though it’s somewhat fickle and unwieldy as an active market-timing tool, COT reporting at this zoomed-out level is immensely helpful. It also provides some valuable lessons on the nature of price. The correlation breakdown observed between stocks and super-short-term rates in the first chart above is a reliable cyclical pattern; but it’s valuable seeing how price itself is corroborated by the various parties that make up the market. Here COT provides another affirmation that wherever markets are free and liquid, price is a faithful recapitulation of it’s (often irrational and bias-afflicted) participants.
If monetary policy tightening continues, Fed Funds traders are well-positioned – whatever their various objectives – to take advantage of a rate environment that has nowhere to go but up. This trade is years in the making and should take no one by surprise. Meanwhile, ES closed Friday roughly -3.5% off all time high after advancing over 1% on the day, leaving markets to head into yet another weekend with the all-too-familiar theme of chastened bears and sanguine bulls in mind. Despite this, the context of a renewed ES:ZQ correlation breakdown and its historical precedent set over the last 15 years, the chances of equities suffering a deeper correction in the near future appear high.
On Twitter: @andrewunknown
Author holds no position in securities mentioned at the time of publication. Commentary provided is for educational purposes only and in no way constitutes trading or investment advice.
 Rolling Over At Key Fibonacci Level?")


 Rolling Over At Key Fibonacci Level?")
