Perhaps one of the most overlooked realities in the market is the law of diminishing returns. I ascribe it being overlooked to the boiling frog problem.
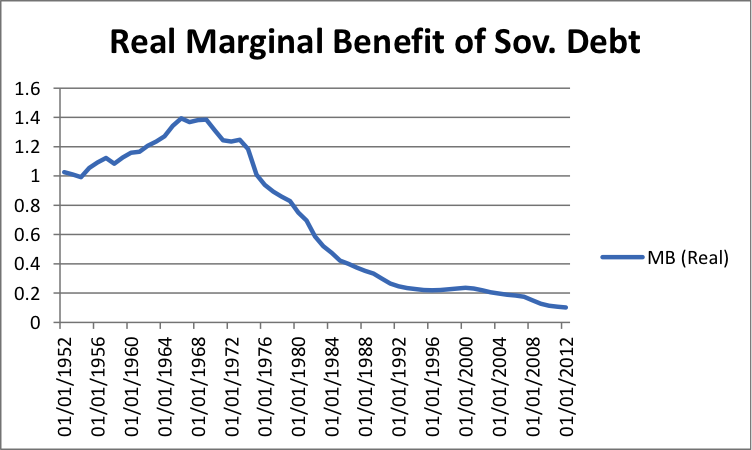
To highlight this reality I thought I’d take a look at one of the more illustrious cases I could find: that of U.S. sovereign debt. In essence I’ve asked the question “How much of a bang is U.S. real GDP getting for other people’s bucks?” and will try to illustrate the answer over the past 60 years.
Although private sector credit expansion is a prerequisite for sustained real GDP growth, private and public debt levels have largely gone in the same direction over the past 60 years. In other words, I’ve used the growth rate in U.S. sovereign debt as a proxy for growth in the total credit market. It’s by no means perfect, but it definitely illustrates the law of diminishing returns over a longer time scale.
At present, $1 of additional debt generates approximately $0.102 of additional real GDP… hardly anything to write home about. For your viewing pleasure, here is a chart showing how that number has constantly declined over the last 45 years or so. The steady decline in the curve between 1970 and now is nothing short of textbook worthy.
Real Marginal Benefit of U.S. Sovereign Debt
Thanks for reading.
Twitter: @maxmoore306 and @seeitmarket
Any opinions expressed herein are solely those of the author and do not in any way represent the views or opinions of his employer or any other person or entity.

: Worrisome to Broader Market?")

