Stocks are off the lows for the year but have traded all over the place lately (trendless). Investors are waiting to see if bulls have another “charge” in them. More specifically, they are waiting for equities momentum to surge.
Here’s our latest look at key technical and fundamental indicators and market trends for the trading week ending June 1, 2018.
Key Takeaways: The May rally in stocks has been accompanied by an upturn in investor sentiment. While not seeing evidence of internal breakdowns, the rally has generally lacked conviction. Momentum in equities is lackluster and breadth thrusts have been conspicuous by their absence. Without the broad market showing meaningful signs of strength, the trading range environment is likely to persist.
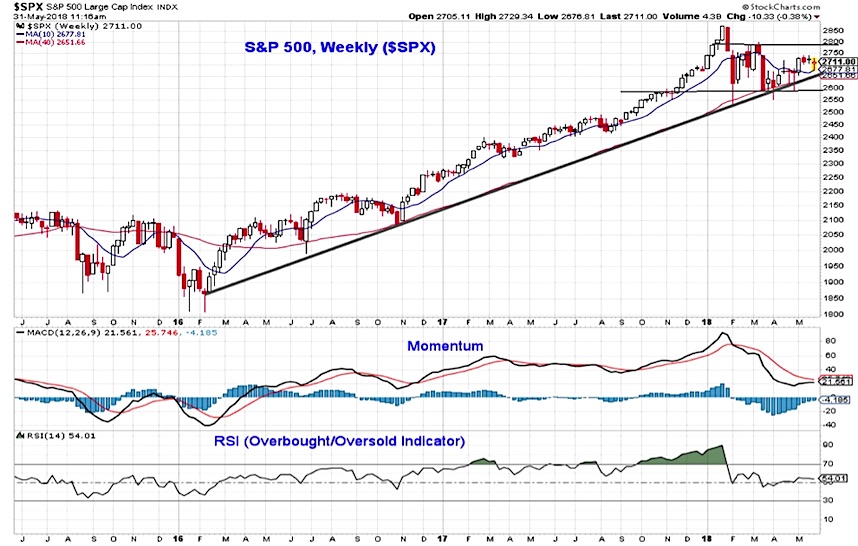
With back-to-back 1% swings in the S&P 500 this week (the 33rdand 34thsuch moves this year), daily price volatility in stocks may be re-emerging. Stepping back from the noise, however, the weekly chart on the S&P 500 shows that the trading range that has been intact since late January persists. This suggests support on the index near 2600 and resistance near 2800.
Despite the move higher in price since early April, the momentum trend has not meaningfully improved. Perhaps because this has been more of a drift than a surge, and the S&P 500 has yet to mount a serious challenge of the March highs. After the early-year pullback relieved the overbought condition that had emerged, the ongoing consolidation in the index has helped keep the RSI from plunging toward oversold territory. A move toward 30 on the RSI would call into question the health of the cycle rally off of the 2016 lows.
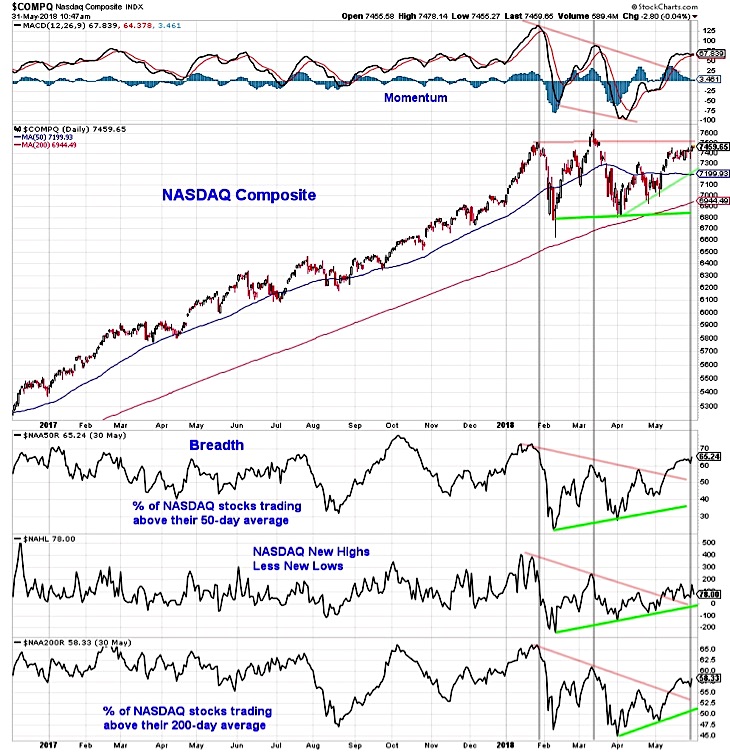
While the S&P 500 and the Dow Industrials have been largely range bound and are near where they began the year, price trends for the NASDAQ Composite and the small-cap indexes have been more encouraging. The NASDAQ is approaching the all-time highs seen in January and March, and small caps have already returned to record territory. While strong from a price perspective, there is evidence that these rallies are not garnering the type of internal support that would suggest they are sustainable.
On the NASDAQ, the percent of stocks above their 50-day average has expanded, but both the number of net new highs and the percent of stocks above their 200-day averages remain below their March peaks, which in turn were below their January highs. In terms of small caps, despite new index highs, nearly 30% of the stocks in the small-cap S&P 600 are still 20% or more below their 52-week highs. This is nearly twice as many stocks as have been making new highs of their own.
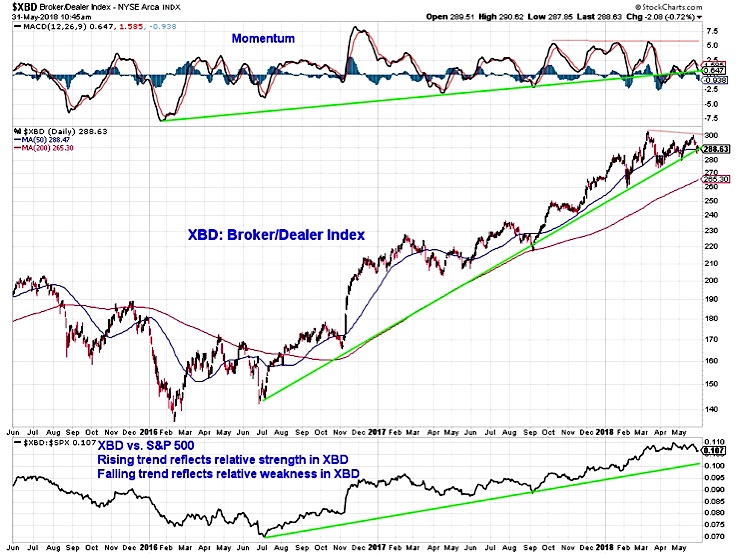
If stocks overall are poised to break out and the cyclical rally is to resume, history would suggest that broker/dealers would be leading the way. The chart of XBD does not give evidence this is happening. The trend-line off of the 2016 lows is being challenged and momentum has faltered. The relative price line shows that the broker/dealer index is not seeing improvement versus the S&P 500.
More encouragingly, a chart of the Dow Transports shows improving price and momentum trends for that index, perhaps a sign of economic confidence.
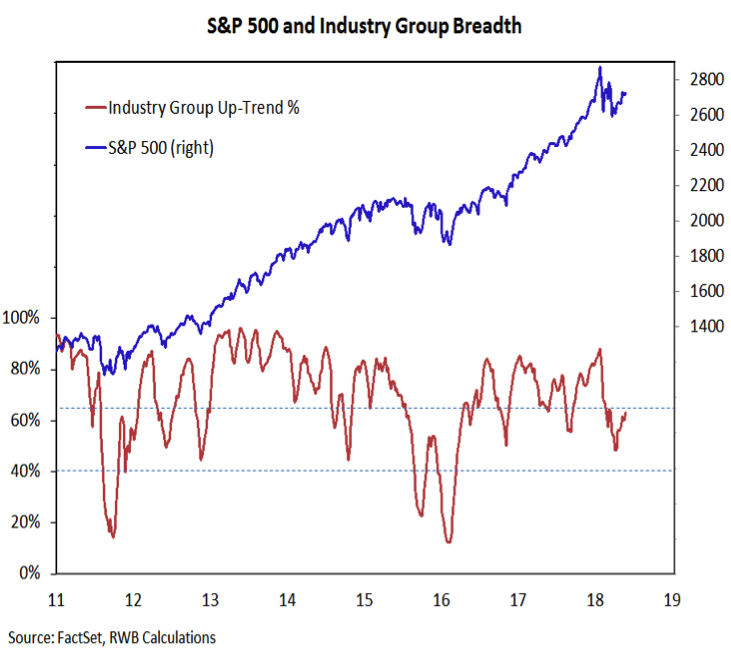
The takeaway from our breadth indicators is that while we have seen some stabilization as the indexes have rallied, we have not seen the level of improvement that would provide a higher level of conviction that the consolidation period is passing. Our industry group trend indicator has bounced off its early-year lows, but at only 63% of industries in up-trends it is hardly signaling strength. Absent evidence of a breadth thrust (seen from a 10-day advance/decline ratio perspective or a couple of 9-to-1 up volume/down volume days), it may be premature to argue that daily and weekly swings are more than just short-term noise.
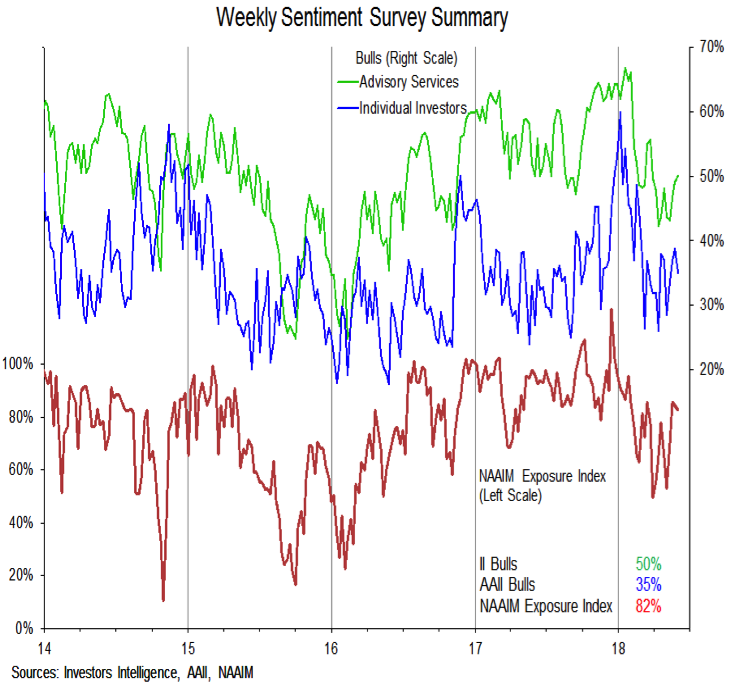
The lack of broad market strength has not kept investors from turning more optimistic. While still shy of the late-2017/early-2018 extremes, optimism as measured by the number of bulls on the AAII and II investor surveys and the NAAIM exposure index has been rising. Importantly from our perspective, the 2018 lows in these sentiment indicators remained well above the wash-out readings of early 2016. The unwinding in optimism was likely enough to support a bounce in stocks toward the upper end of their trading range, but as confidence has returned that tailwind is starting to ebb.
The NDR Trading Sentiment Composite has been flirting with the excessive optimism zone, further evidence of the shift in sentiment seen over the past month.
Twitter: @WillieDelwiche
Any opinions expressed herein are solely those of the author, and do not in any way represent the views or opinions of any other person or entity.


